Source:AirDNA
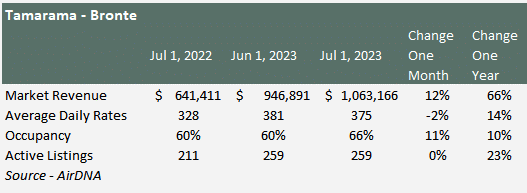
Nestled next to the iconic Bondi Beach, Tamarama and Bronte have emerged as sought-after destinations for travellers seeking a blend of coastal charm and urban convenience. With their pristine beaches and scenic coastal walks, these neighboring suburbs are seeing a small resurgence in Airbnb listings, reflecting their growing popularity among tourists. Tamarama and Bronte boasted 259 properties on Airbnb in July 2023. Delving deeper into the data, we uncover the following insights about the Tamarama and Bronte market:
- 85% are entire homes.
- 15% are private rooms.
- 0.3% are shared rooms.
- 27% of the rentals are 1-bedroom properties.
- 39% of the rentals are 2-bedroom properties
- The average rating is 4.75, with 83% of properties rated 4.5 or higher.
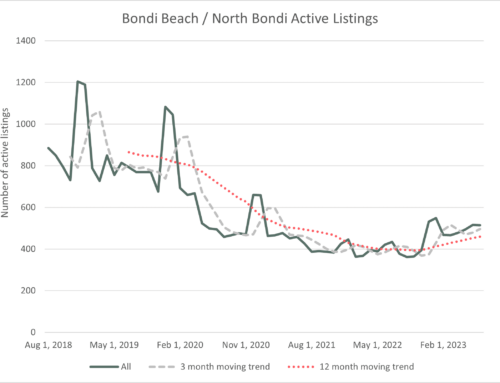
Post-COVID, the Bondi Beach / North Bondi Airbnb market is on the rebound:
- Market revenue surged by 66% over the past year, fuelled by the resurgence of short-term visitors to NSW and Australia.
- Average daily rates climbed by 14% in the same period, helping to drive market revenue.
- Occupancy rates are relatively steady at 66% in July 2023, up from 60% a year ago.
- Total listings have grown by 23% in the last year but are down on pre-COVID levels of the January 2019 peak of 750 properties by 65%.
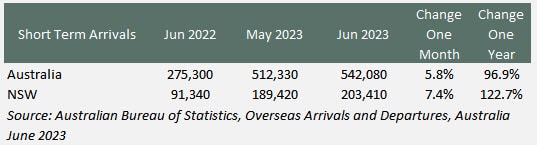
Short-Term Visitors to Australia
The primary catalyst for the uptick in bookings is the surge in short-term visitors to both Australia and NSW. Over the past year, tourist arrivals have soared by 96.9% for Australia and 122.7% for NSW. However, the growth rate moderated to single digits from June to July.
Interest Rates
In conjunction with the rise in short-term visitors to Australia, there has been a significant rise in interest rates. Discounted Variable Home Loan rates were at a low from August 2021 to April 2022 at 3.45%, rising to 7.06% in June 2023.
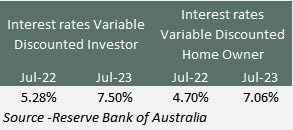
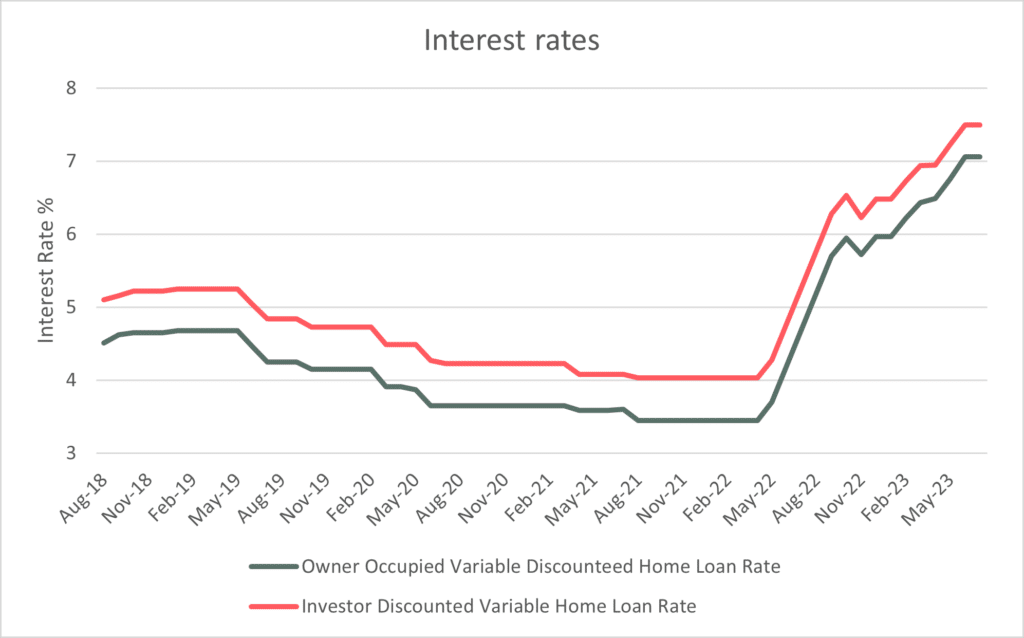
Source – Reserve Bank of Australia
Market Rates
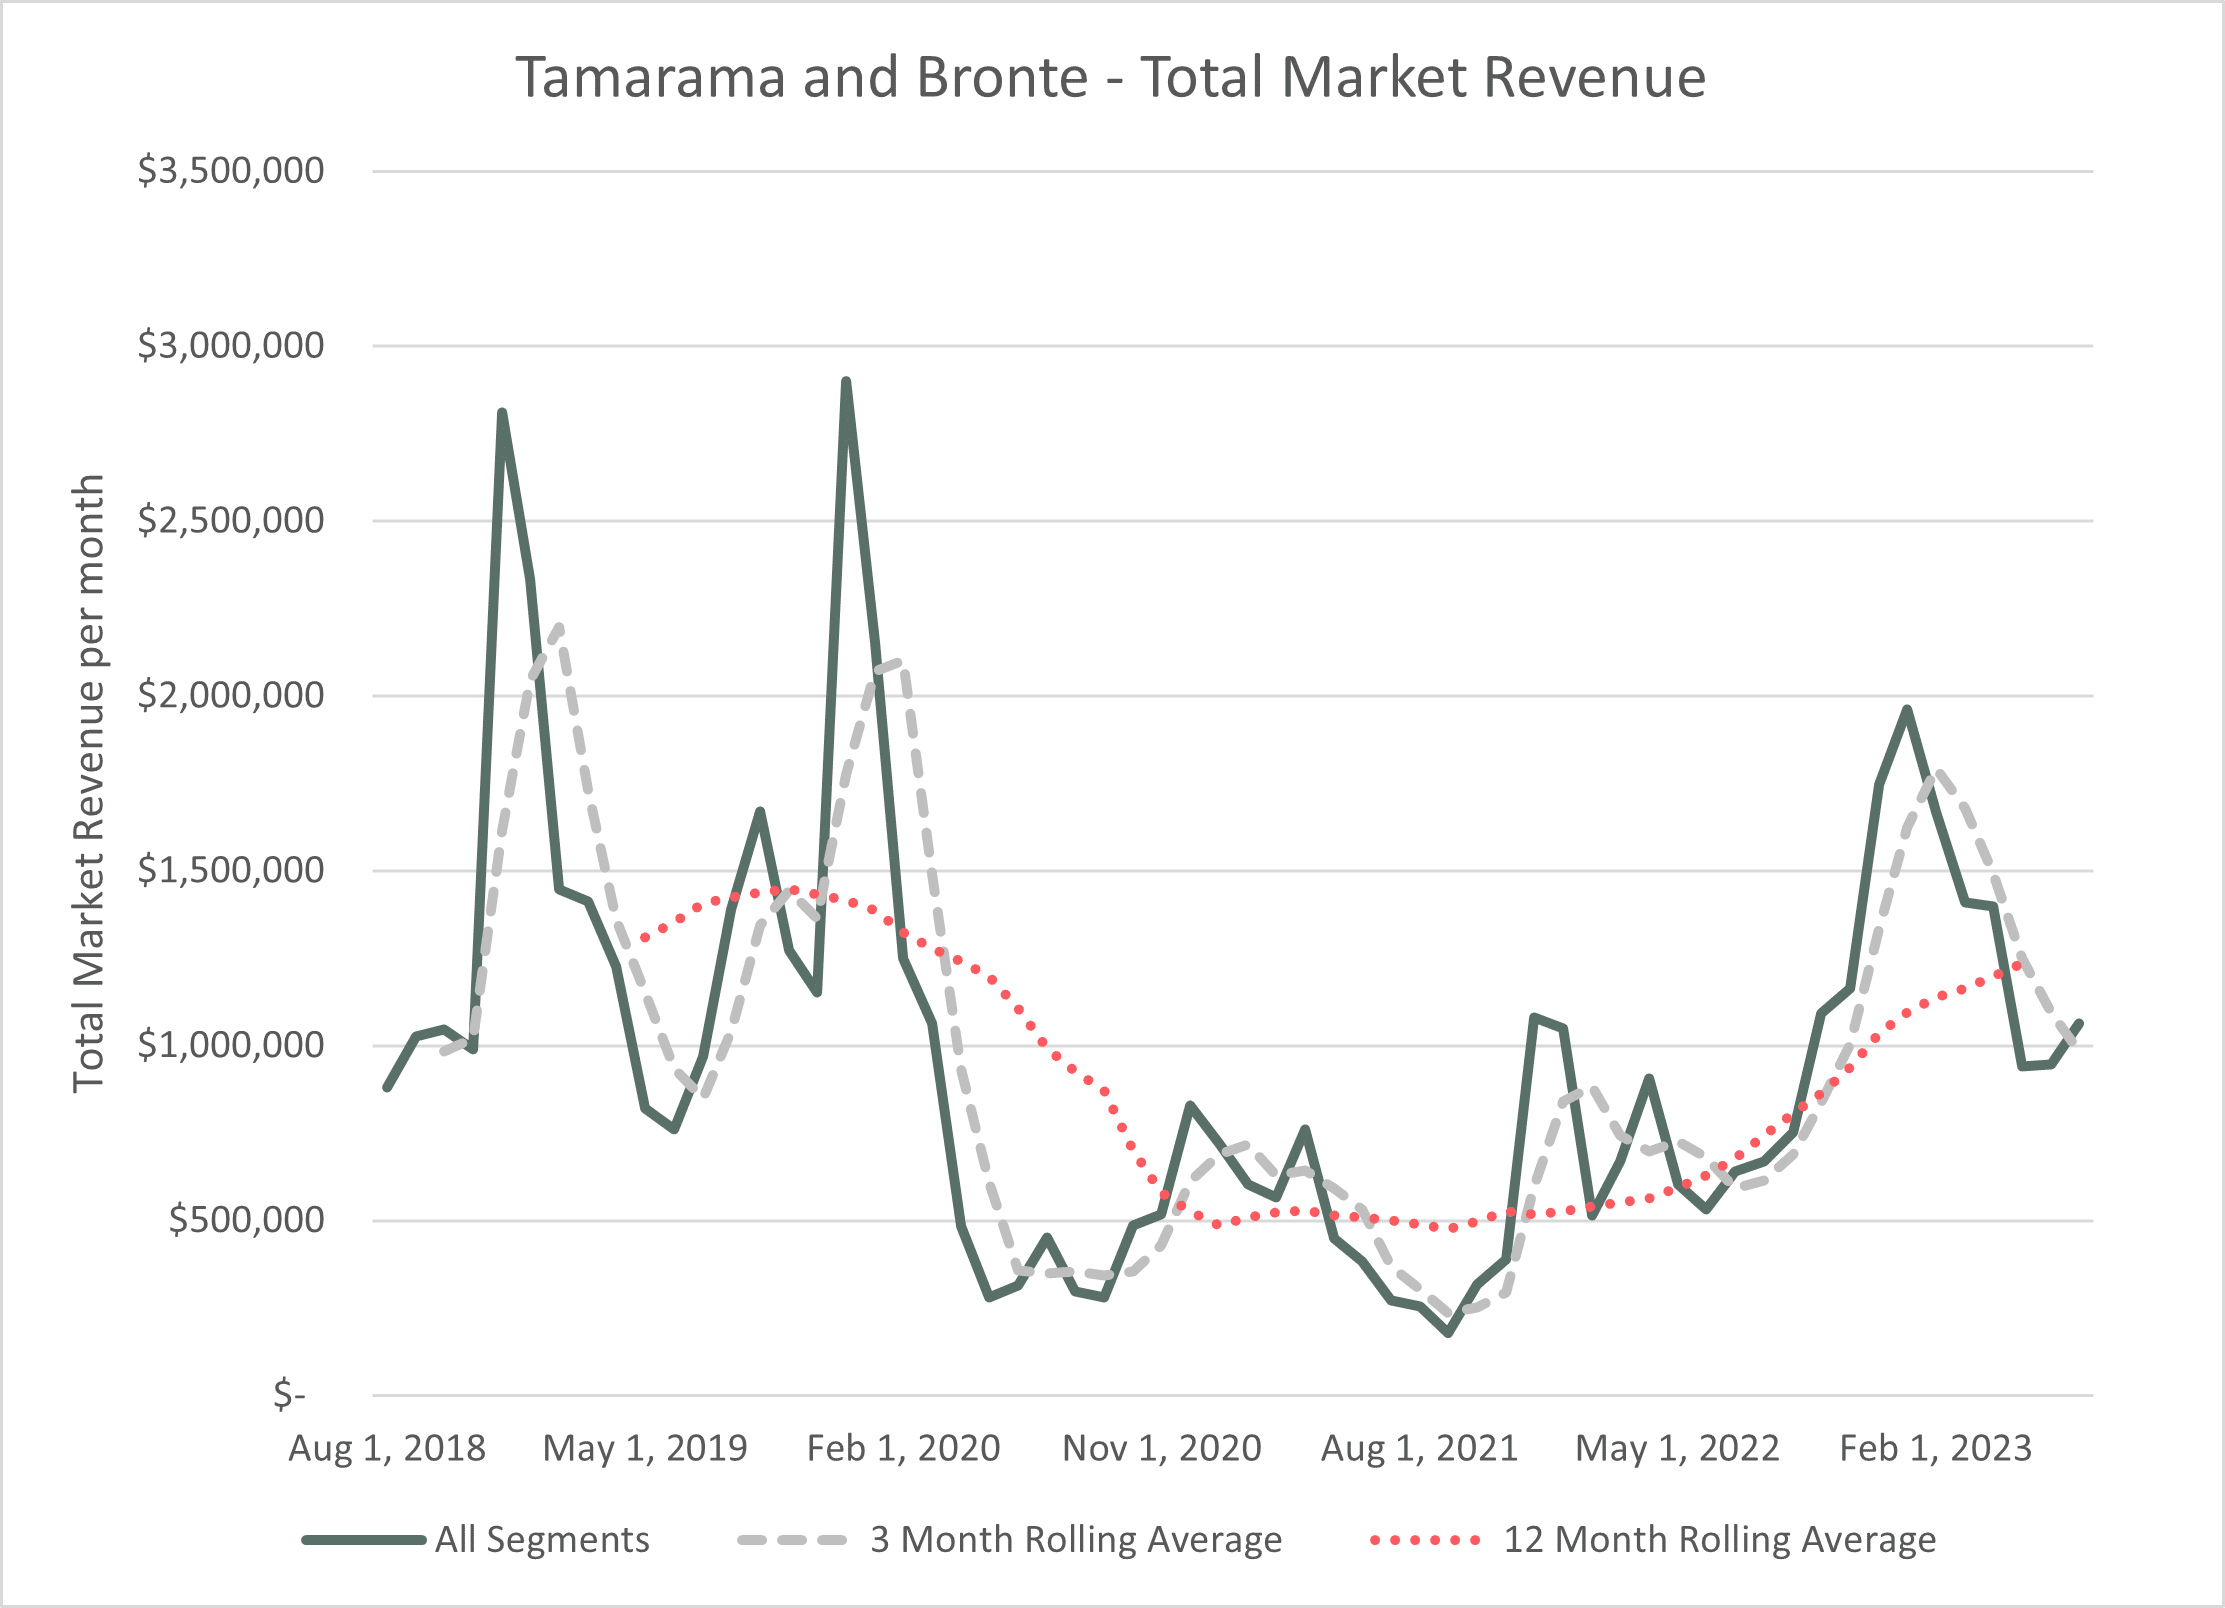
Market revenue continues to show improvement. The graph below shows the seasonality in the Bondi Beach market. The three big spikes (two pre-COVID) and one post-COVID are December 2018, December 2019, and December 2022. Summer, as expected, is an essential period for Bondi.
Source:AirDNA
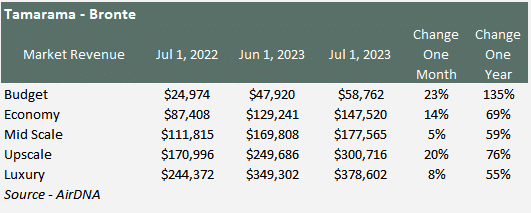
The market is categorised into five quintiles: Budget, Economy, Mid-Scale, Upscale, and Luxury. In the last 12 months there has been high double-digit growth in all quintiles, although the budget segment has shown the strongest growth up 135%. However, this segment is coming off a low base relative to the other segments. The strongest performer in dollar terms have been the Luxury and Upscale segments which have seen a monthly market revenue increase of $134,230 and $129,720 over the last 12 months. These increases alone are twice the size of the budget segment.
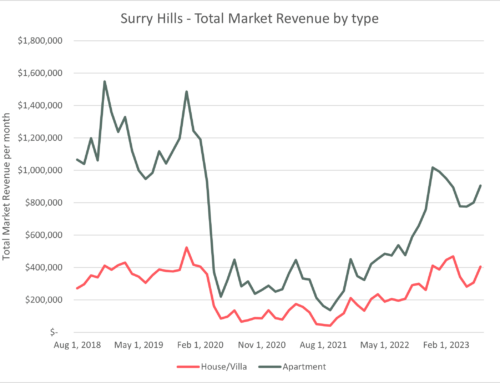
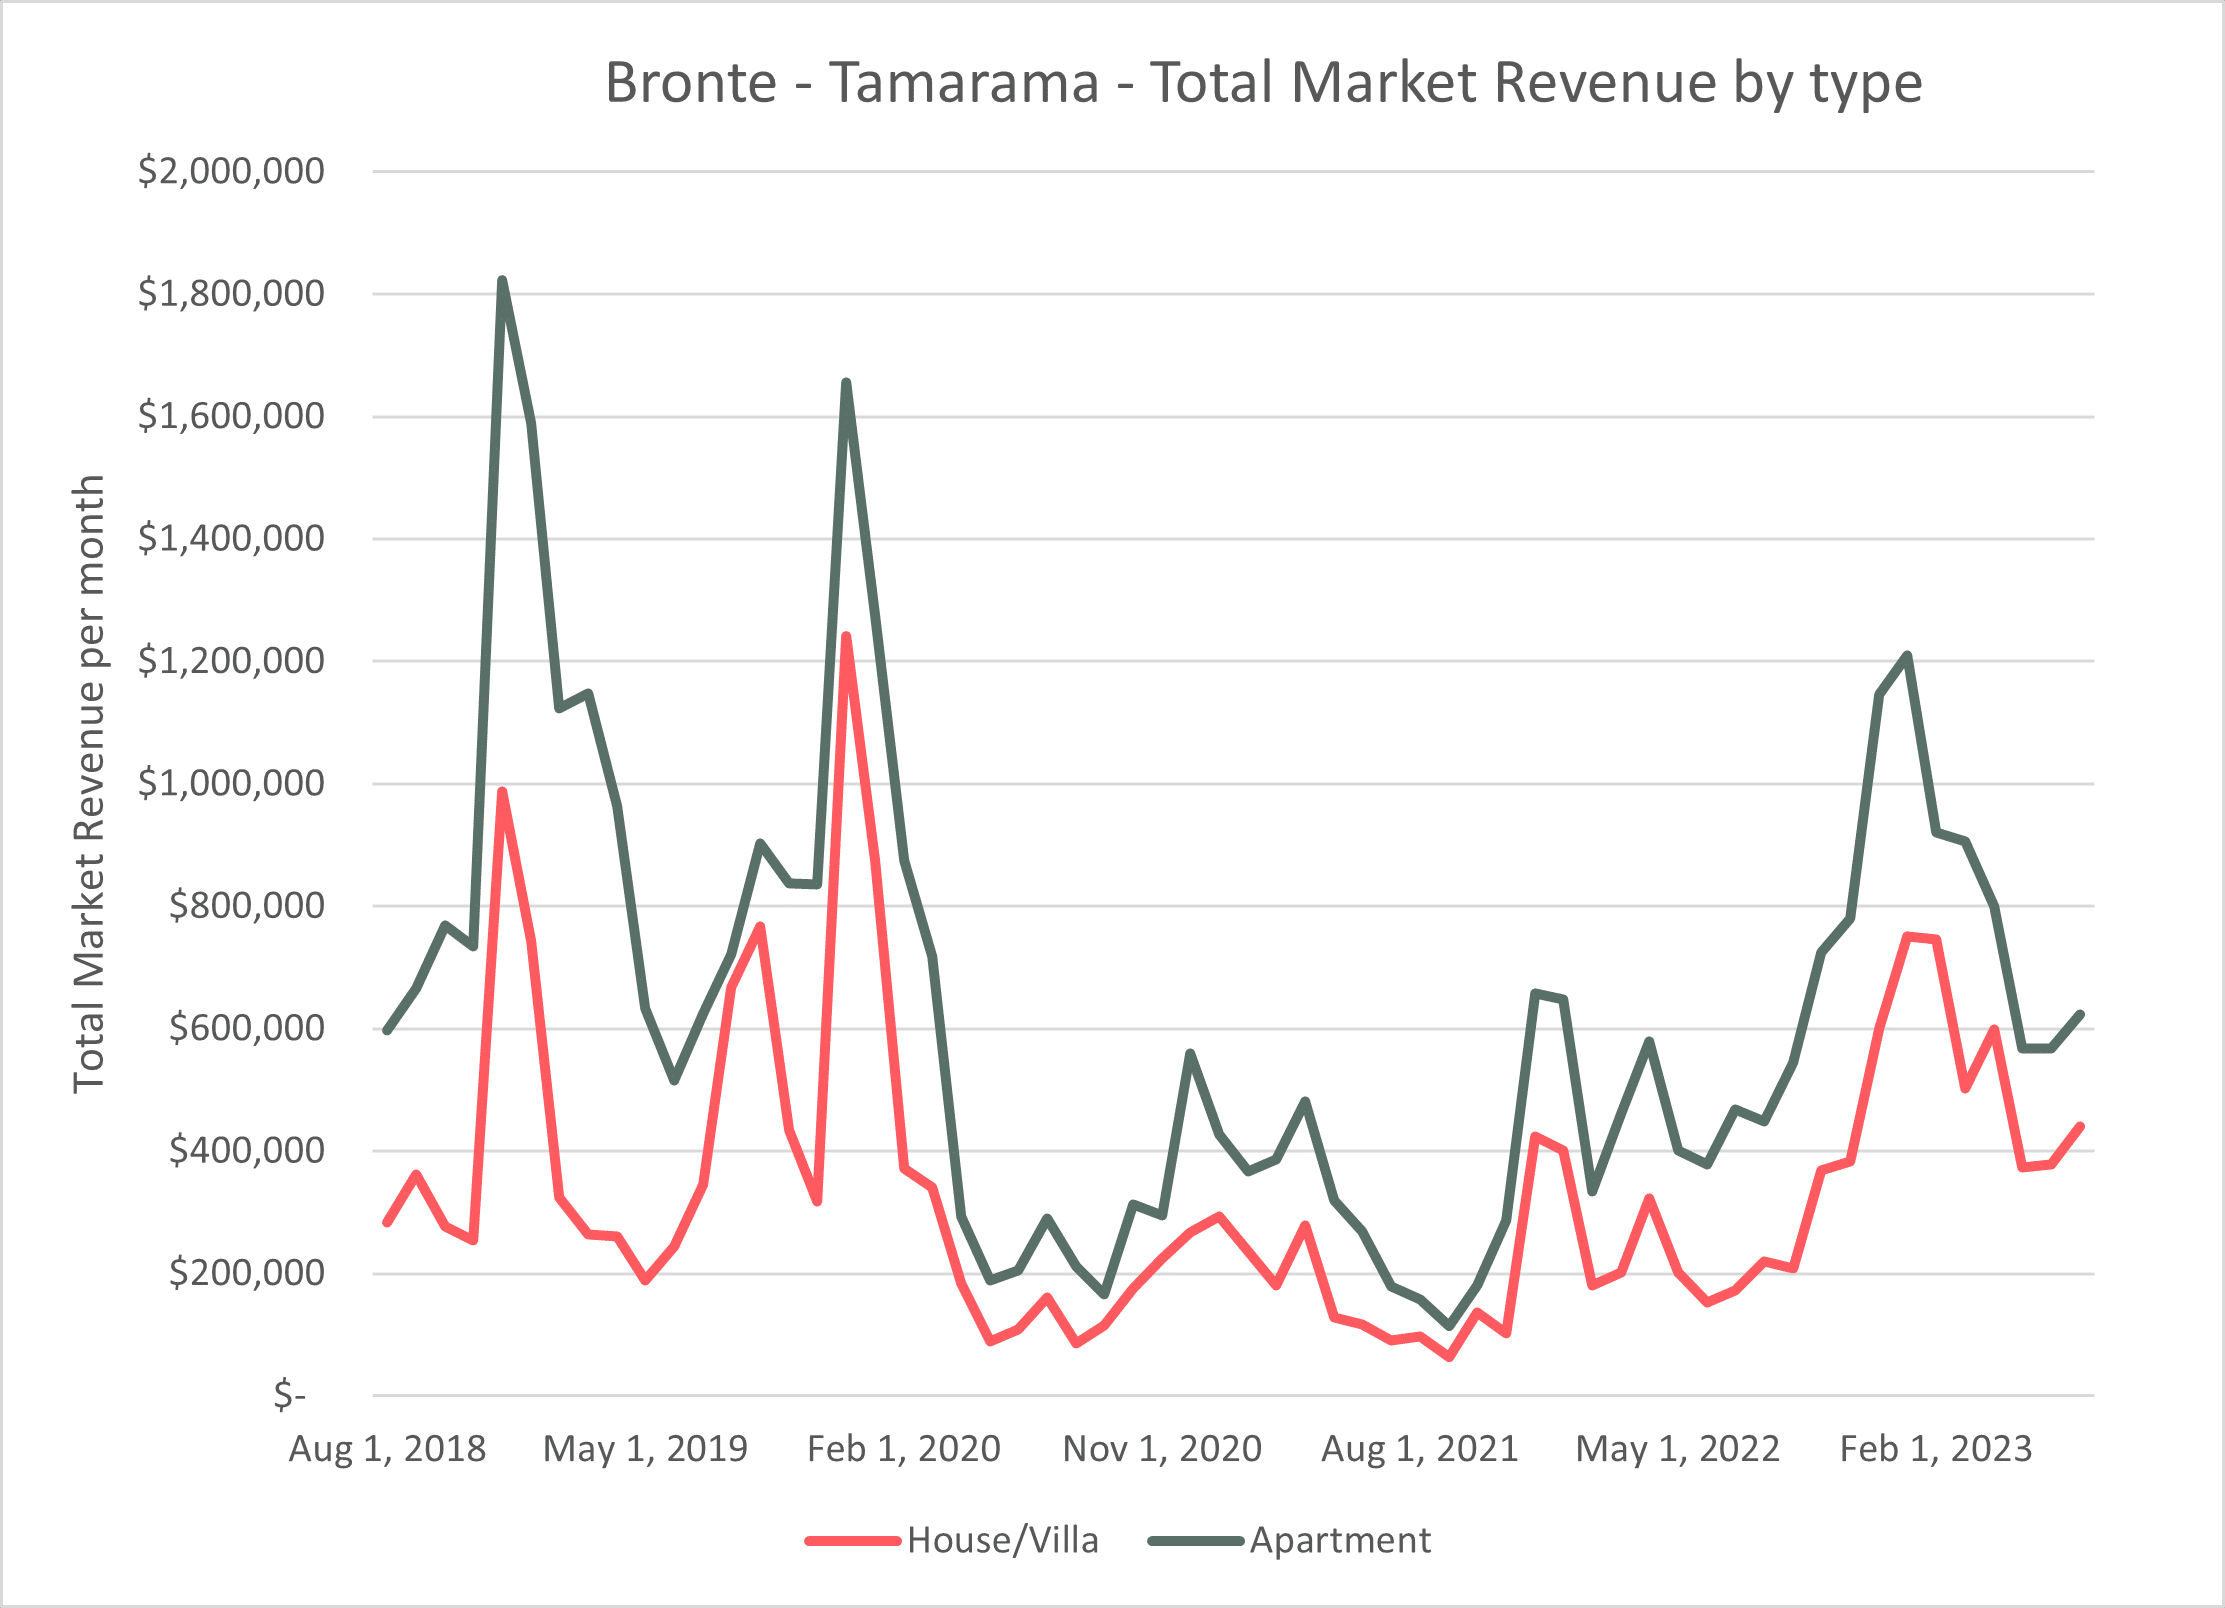
Apartments represent almost 59% of market revenue earned in Tamarama and Bronte, and they have shown growth of 33% over the last 12 months. But Houses are making a strong recovery and market revenue for the last 12 months up 155%. To demonstrate the recovery I houses, they represented just 27% of market revenue 12 months ago and are now 41% of market revenue.
Source:AirDNA
Average Daily Rates
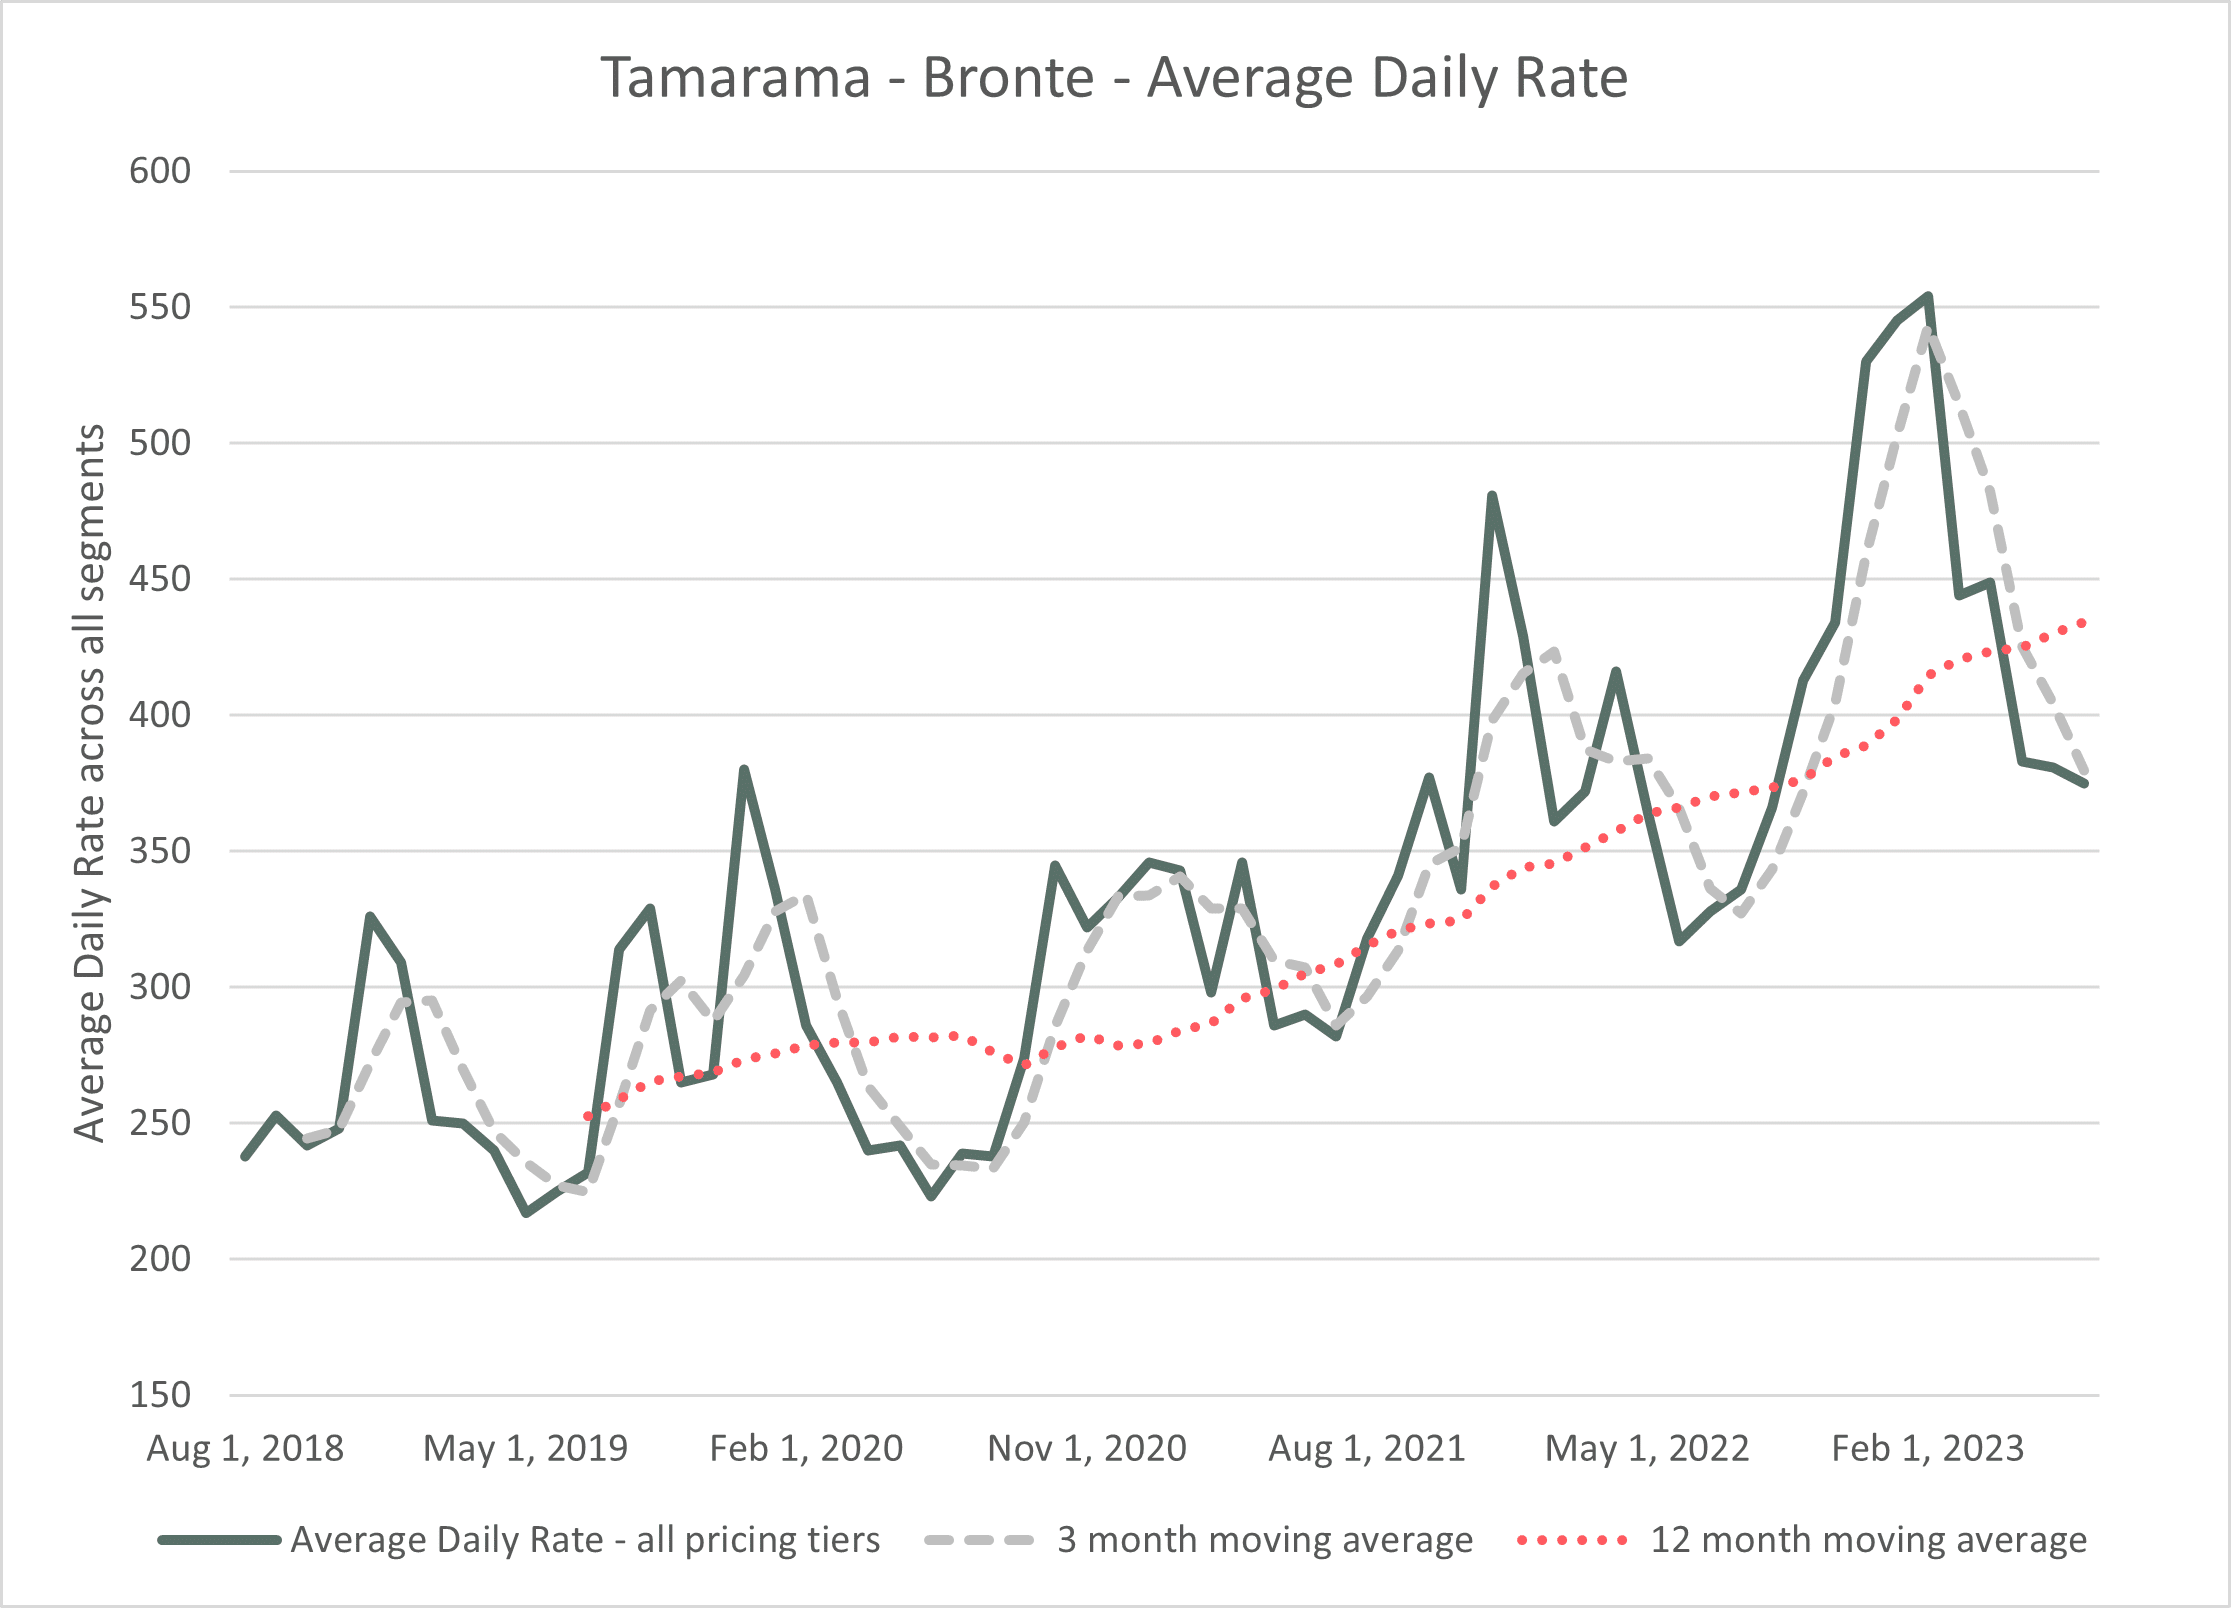
Due to the slow recovery in active listings combined with a strong growth in short term visitors to Australia, we have seen strong upward trend in the average daily rate. In July 2023 the average daily rate was $375, up 14% for the year. The 12 month moving average continue to show continued improvement despite seasonality.
Source:AirDNA
The last month as seen a small decline in average rates which is not unexpected for the middle of the winter/offseason. However, all segments have shown positive growth in the last 12 months with the leaders at each end of the spectrum, budget up 56% and Luxury up 23%.
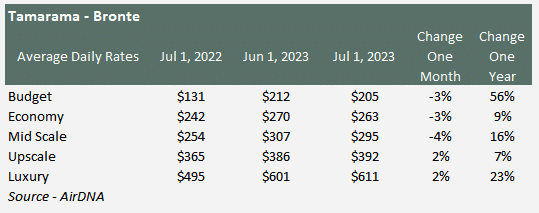
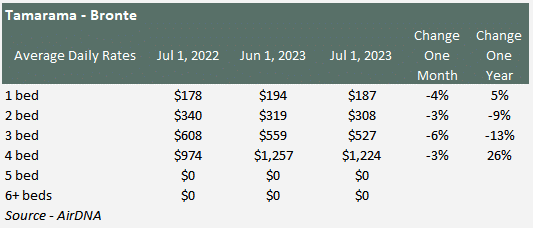
The 4-bedroom market saw a substantial rise in Average Daily Rates over the last 12 months, up 26%, but there are only 18 properties in this segment. The largest segments are one and two bedrooms where competition is likely in these cooler months keeping a partial lid on significant increases in average daily rates.
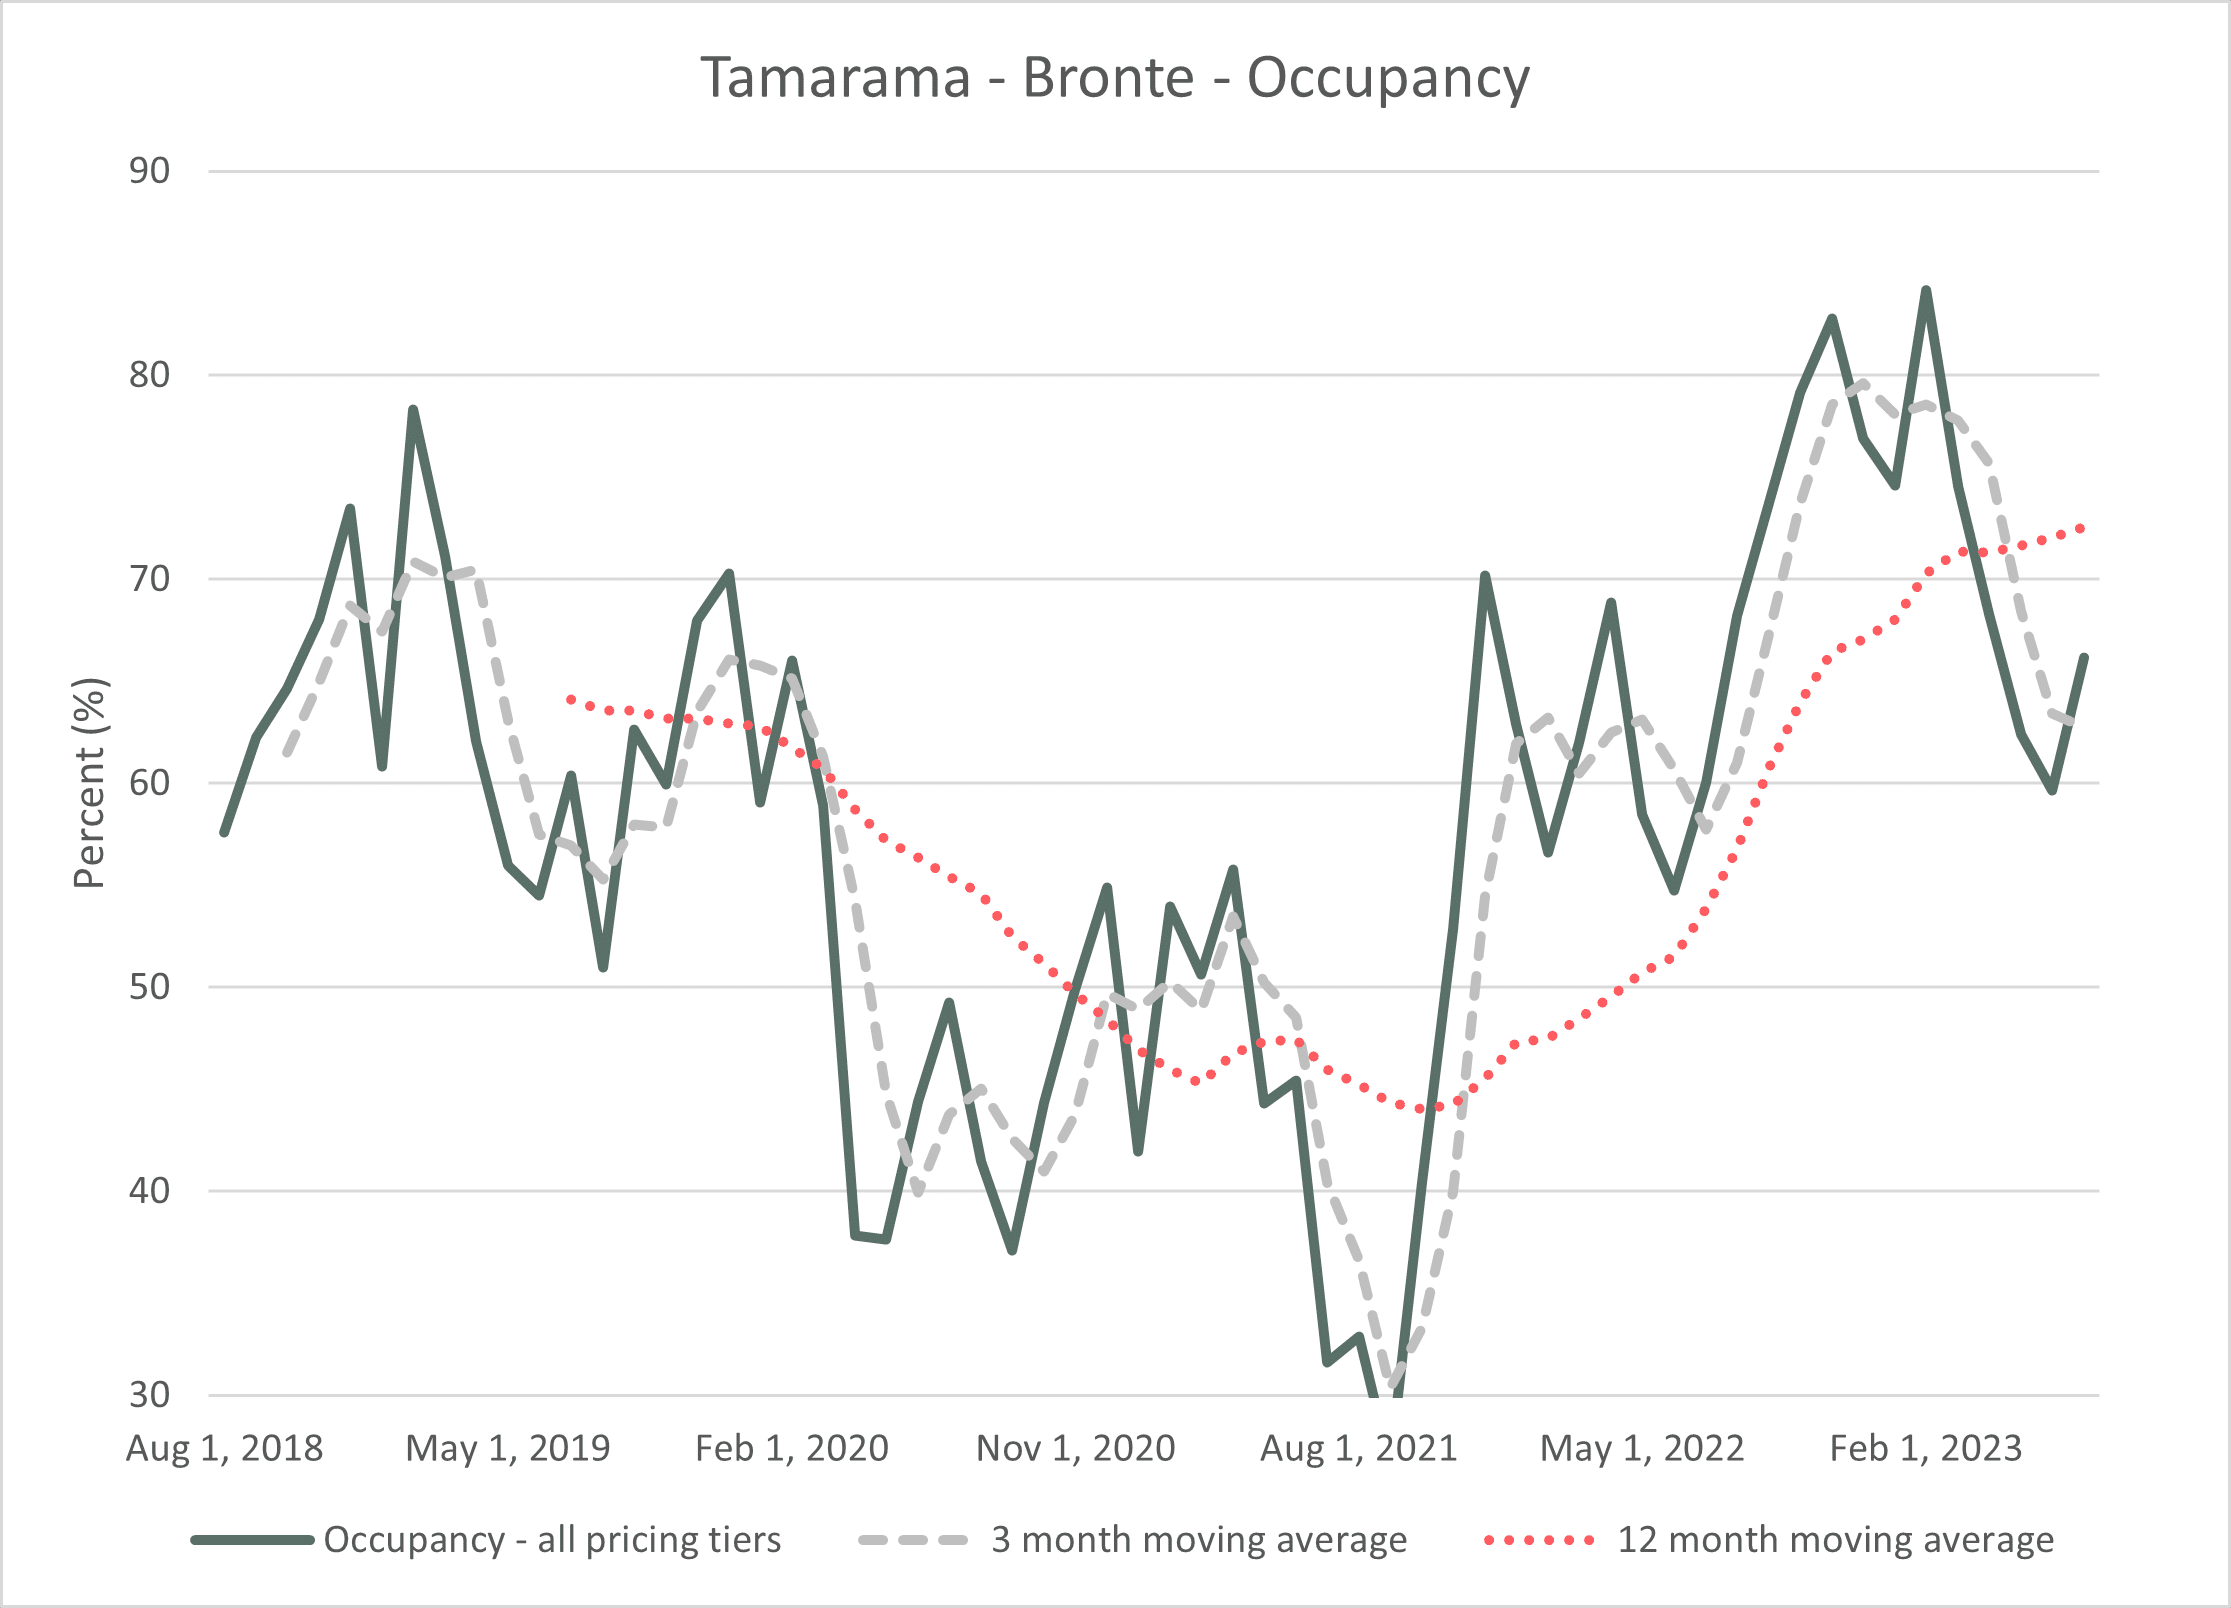
Occupancy
The actual occupancy number from AirDNA should be used sparingly, and it is best to focus on the trend rather than the actual number. There has been a strong upward trend in occupancy since COVID, but this will be driven by the low-level growth of new listings.
Source:AirDNA
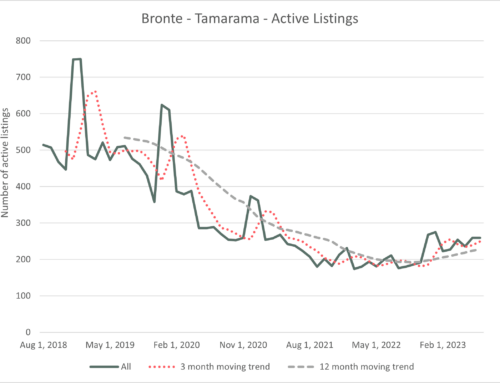
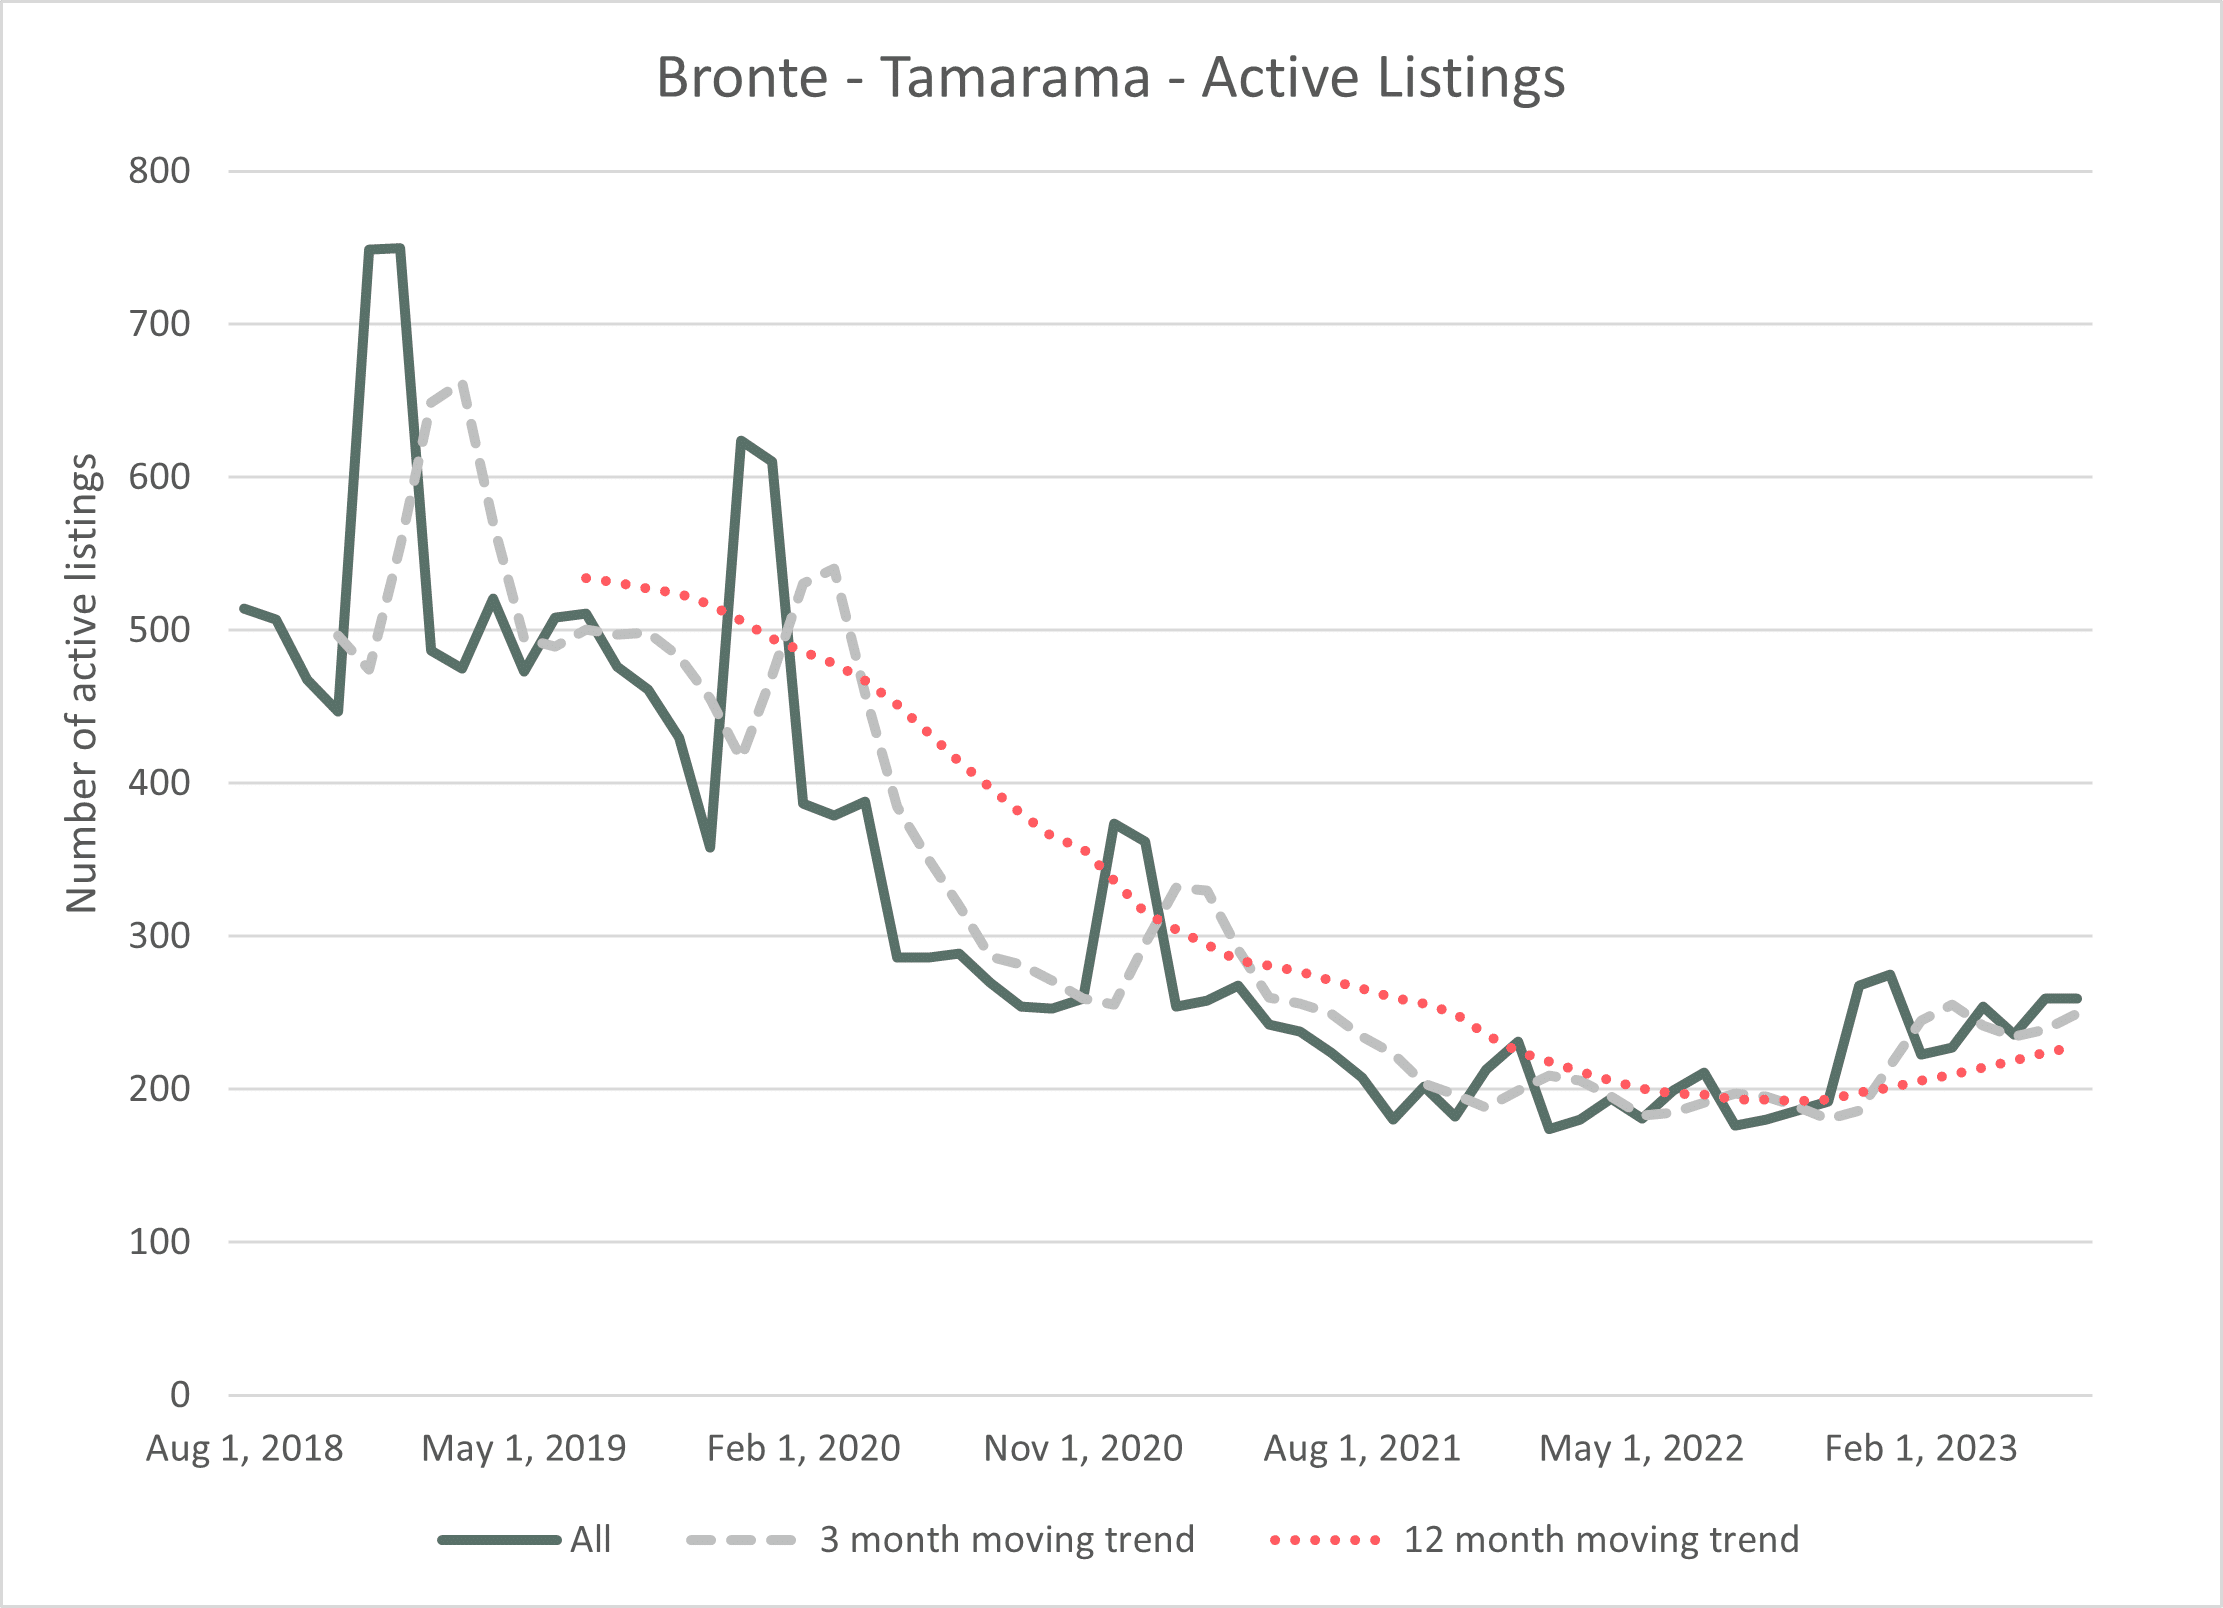
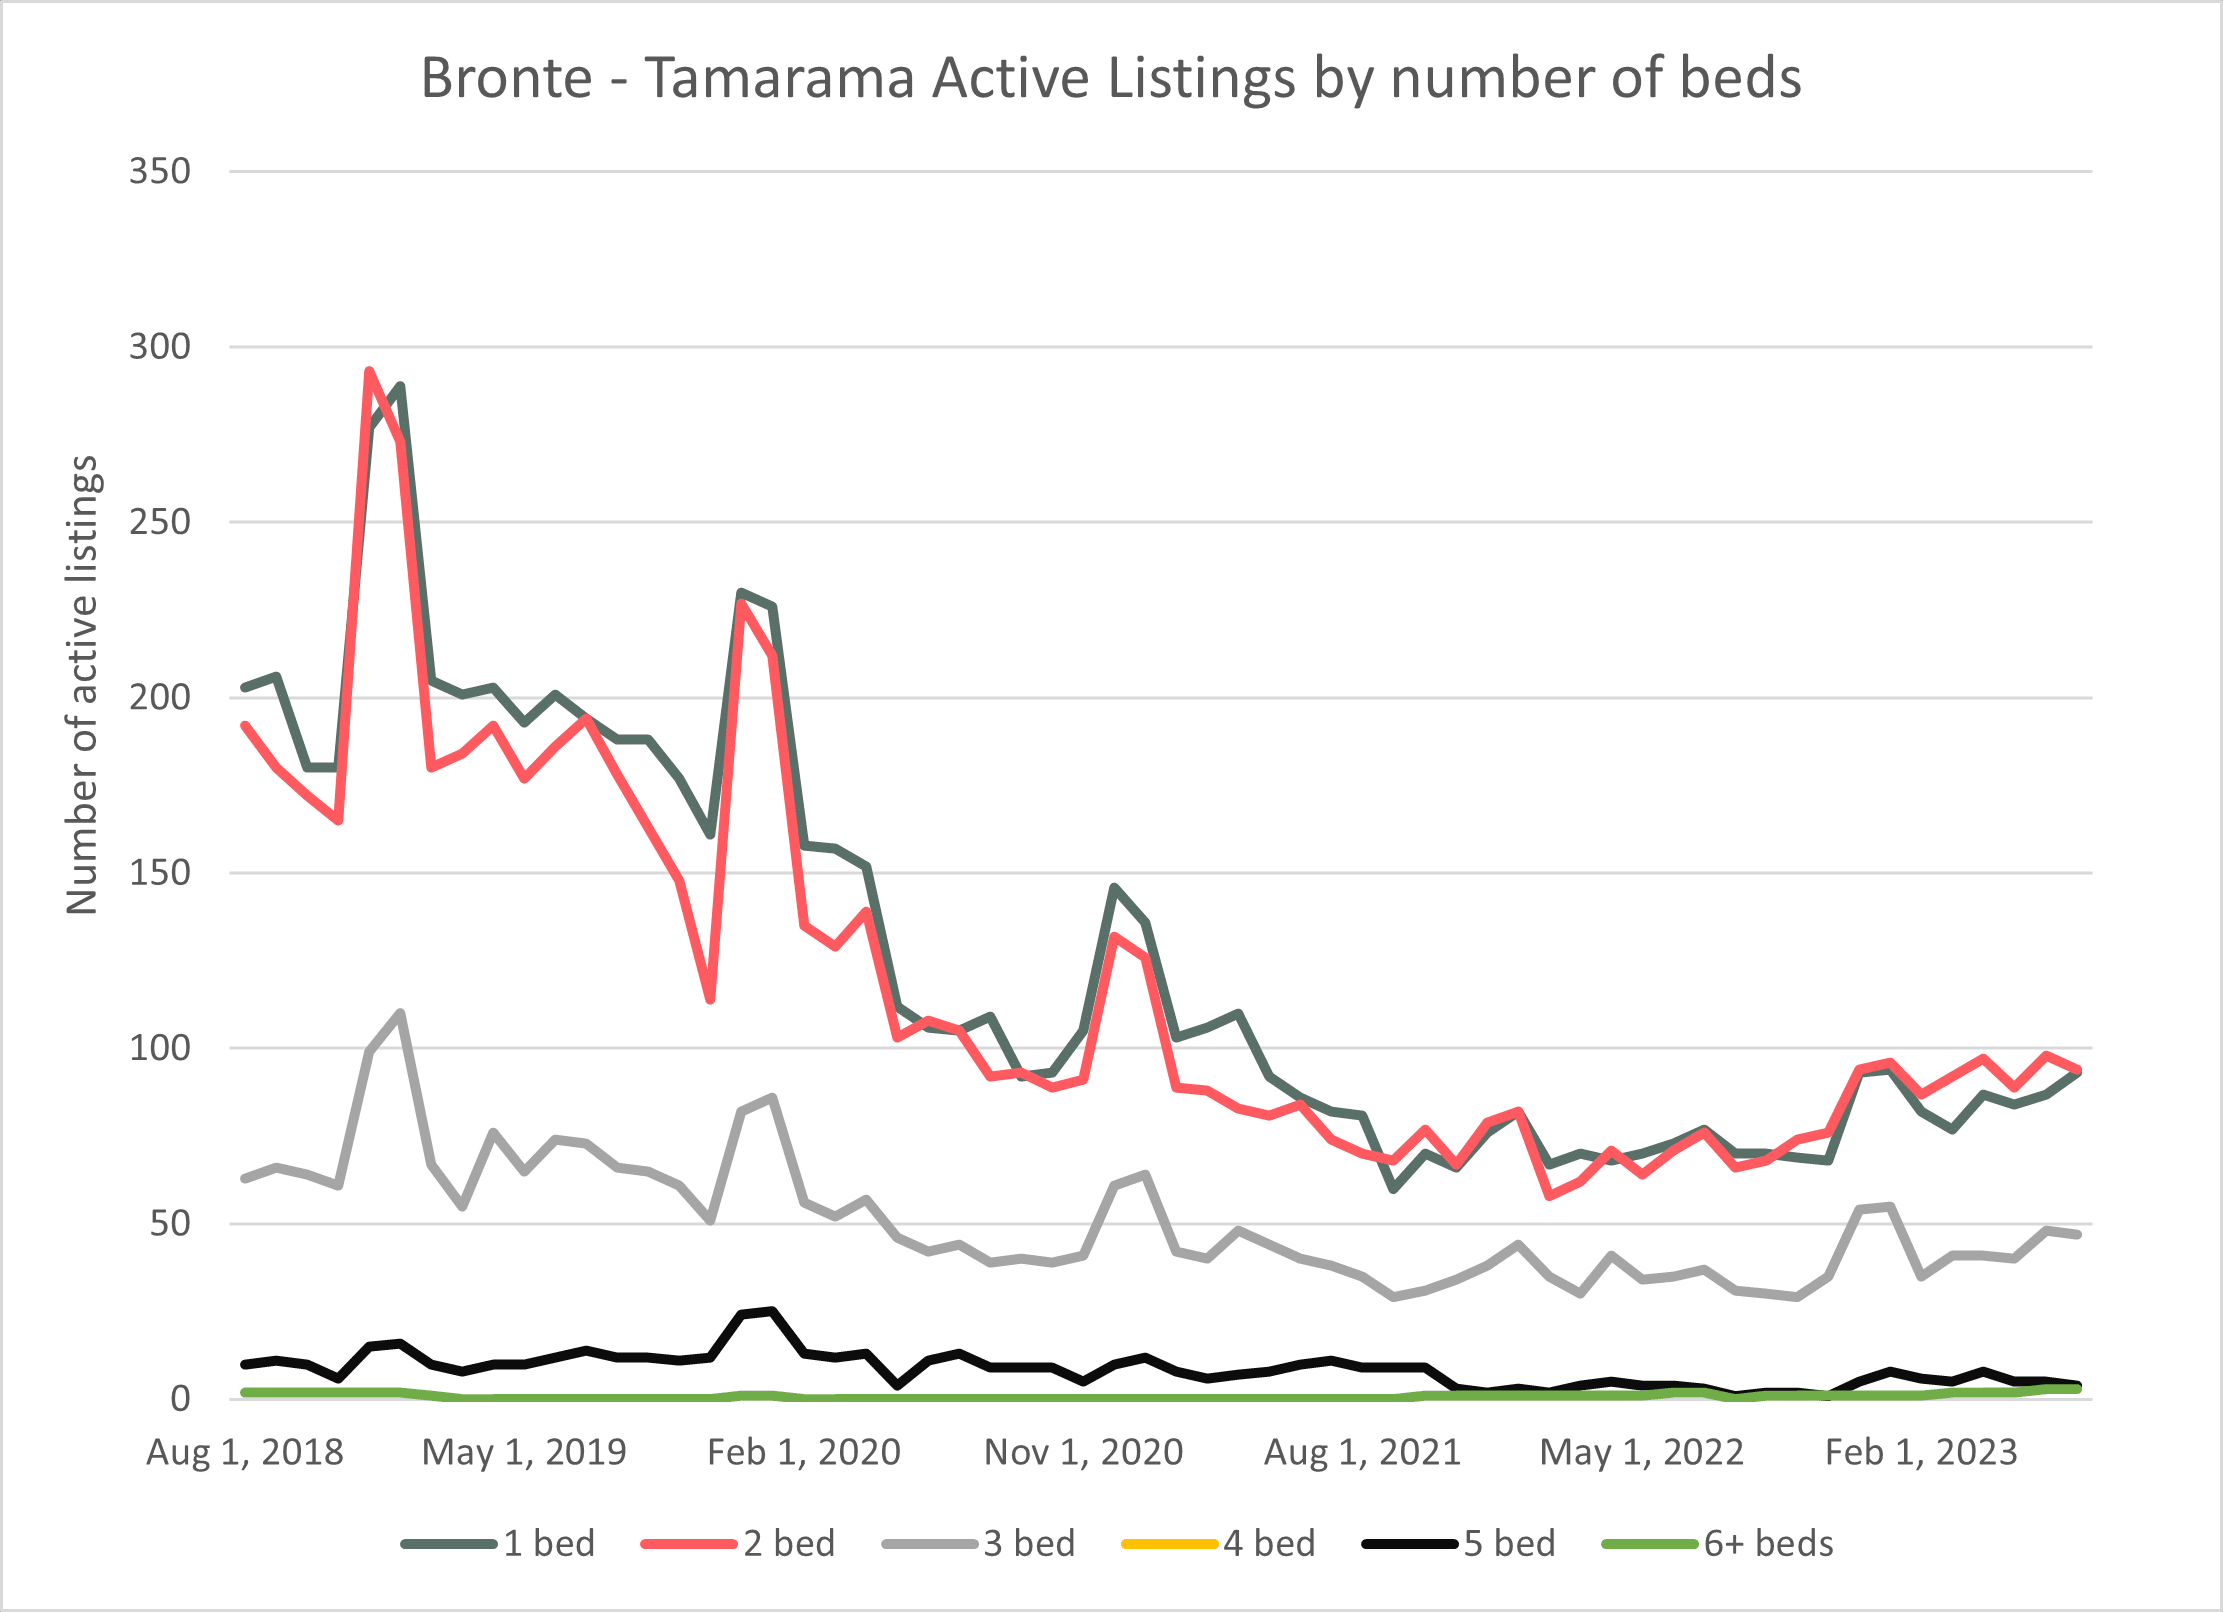
Active Listings
We have referred a number of times to the low level of growth in active listings in Tamarama and Bronte. The lowest number of active listings was February 2022 at 174. Active listings in July 2023 were 259, an increase 48% in the last 16 months. This seems high but is low relative to the peak number of listings at 750 in January 2019. The rise in short-term visitors to Australia has not been reflected in new listings, but it has helped occupancy and average daily rates to rise, and if occupancy were to rise closer to a full, especially in peak periods, we may see growth in active listings increase faster.
Source:AirDNA
The 1 and 2-bed markets have been leading the way in the growth of active listings, which will likely remain the case. If you look back historically, much of the fall in active listings came from 1 and 2-bed properties, so any increase is likely to be significantly driven in this space.
Source:AirDNA
Talk to HomeHost about managing your property in Surry Hills. Call today on 1300 171 718.
AIRDNA Terms
Active Listing Nights – Count of nights within a given period that are not blocked and are either reserved or available as long as there has been a reservation within the last 28 days.
Active – Active vacation rentals are those that had at least one calendar day classified as reserved or available during the reporting period.
Available Listings – Total number of listings whose calendars had at least one day classified as available or reserved during the reporting period.
Average Daily Rate (Native) – Average daily rate (ADR) of booked nights in USD. ADR = Total Revenue / Booked Nights. Includes cleaning fees.
Market Revenue – Total revenue generated in a segment for that period.
Occupancy Rate – Occupancy Rate = Total Booked Days / Active Listing Nights
See the full list of definitions here.
Need expert Airbnb Management?
Talk to Home Host – call 1300 171 718.