Source:AirDNA
The Bondi Beach-North Bondi market attracts a large number of visitors each year, given the famous beach and proximity to restaurants, bars, and the city. There are about 514 properties on Airbnb and Vrbo, representing about 4.9% of properties listed in Sydney on these platforms. A breakdown of the properties in the Bondi Beach market reveals:
- 86% are entire homes.
- 13% are private rooms.
- 0.3% are shared rooms.
- 34% of the rentals are 1-bedroom properties.
- 38% of the rentals are 2-bedroom properties
- The average rating is 4.74, with 80% of properties rated 4.5 or higher.
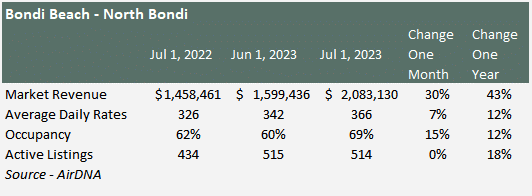
Post-COVID, the Bondi Beach / North Bondi Airbnb market is on the rebound:
- Market revenue surged by 43% over the past year, fuelled by the resurgence of short-term visitors to NSW and Australia.
- Average daily rates climbed by 12% in the same period.
- Occupancy rates are improving at 69% in July 20223. Occupancy in June was 60%, so this number will improve as we head into summer.
- Total listings have grown by 18% in the last year but are down on pre-COVID levels of the January 2019 peak by 57%.
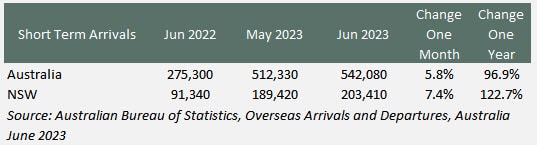
Short-Term Visitors to Australia
The primary catalyst for the uptick in bookings is the surge in short-term visitors to both Australia and NSW. Over the past year, tourist arrivals have soared by 96.9% for Australia and 122.7% for NSW. However, the growth rate moderated to single digits from June to July.
Interest Rates
In conjunction with the rise in short-term visitors to Australia, there has been a significant rise in interest rates. Discounted Variable Home Loan rates were at a low from August 2021 to April 2022 at 3.45%, rising to 7.06% in June 2023.
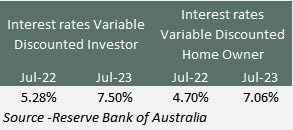
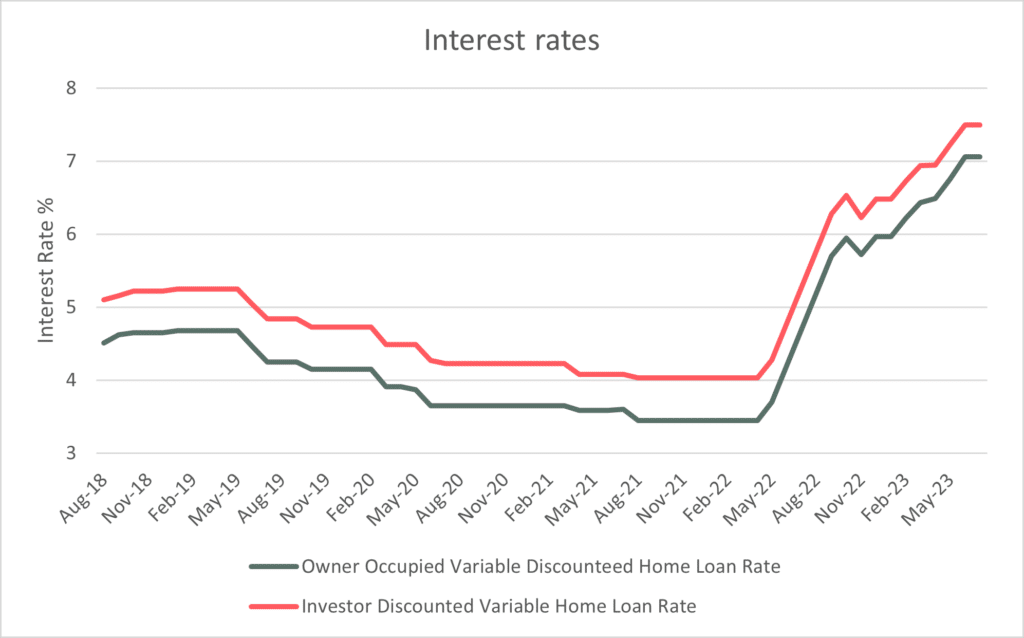
Source – Reserve Bank of Australia
Market Rates
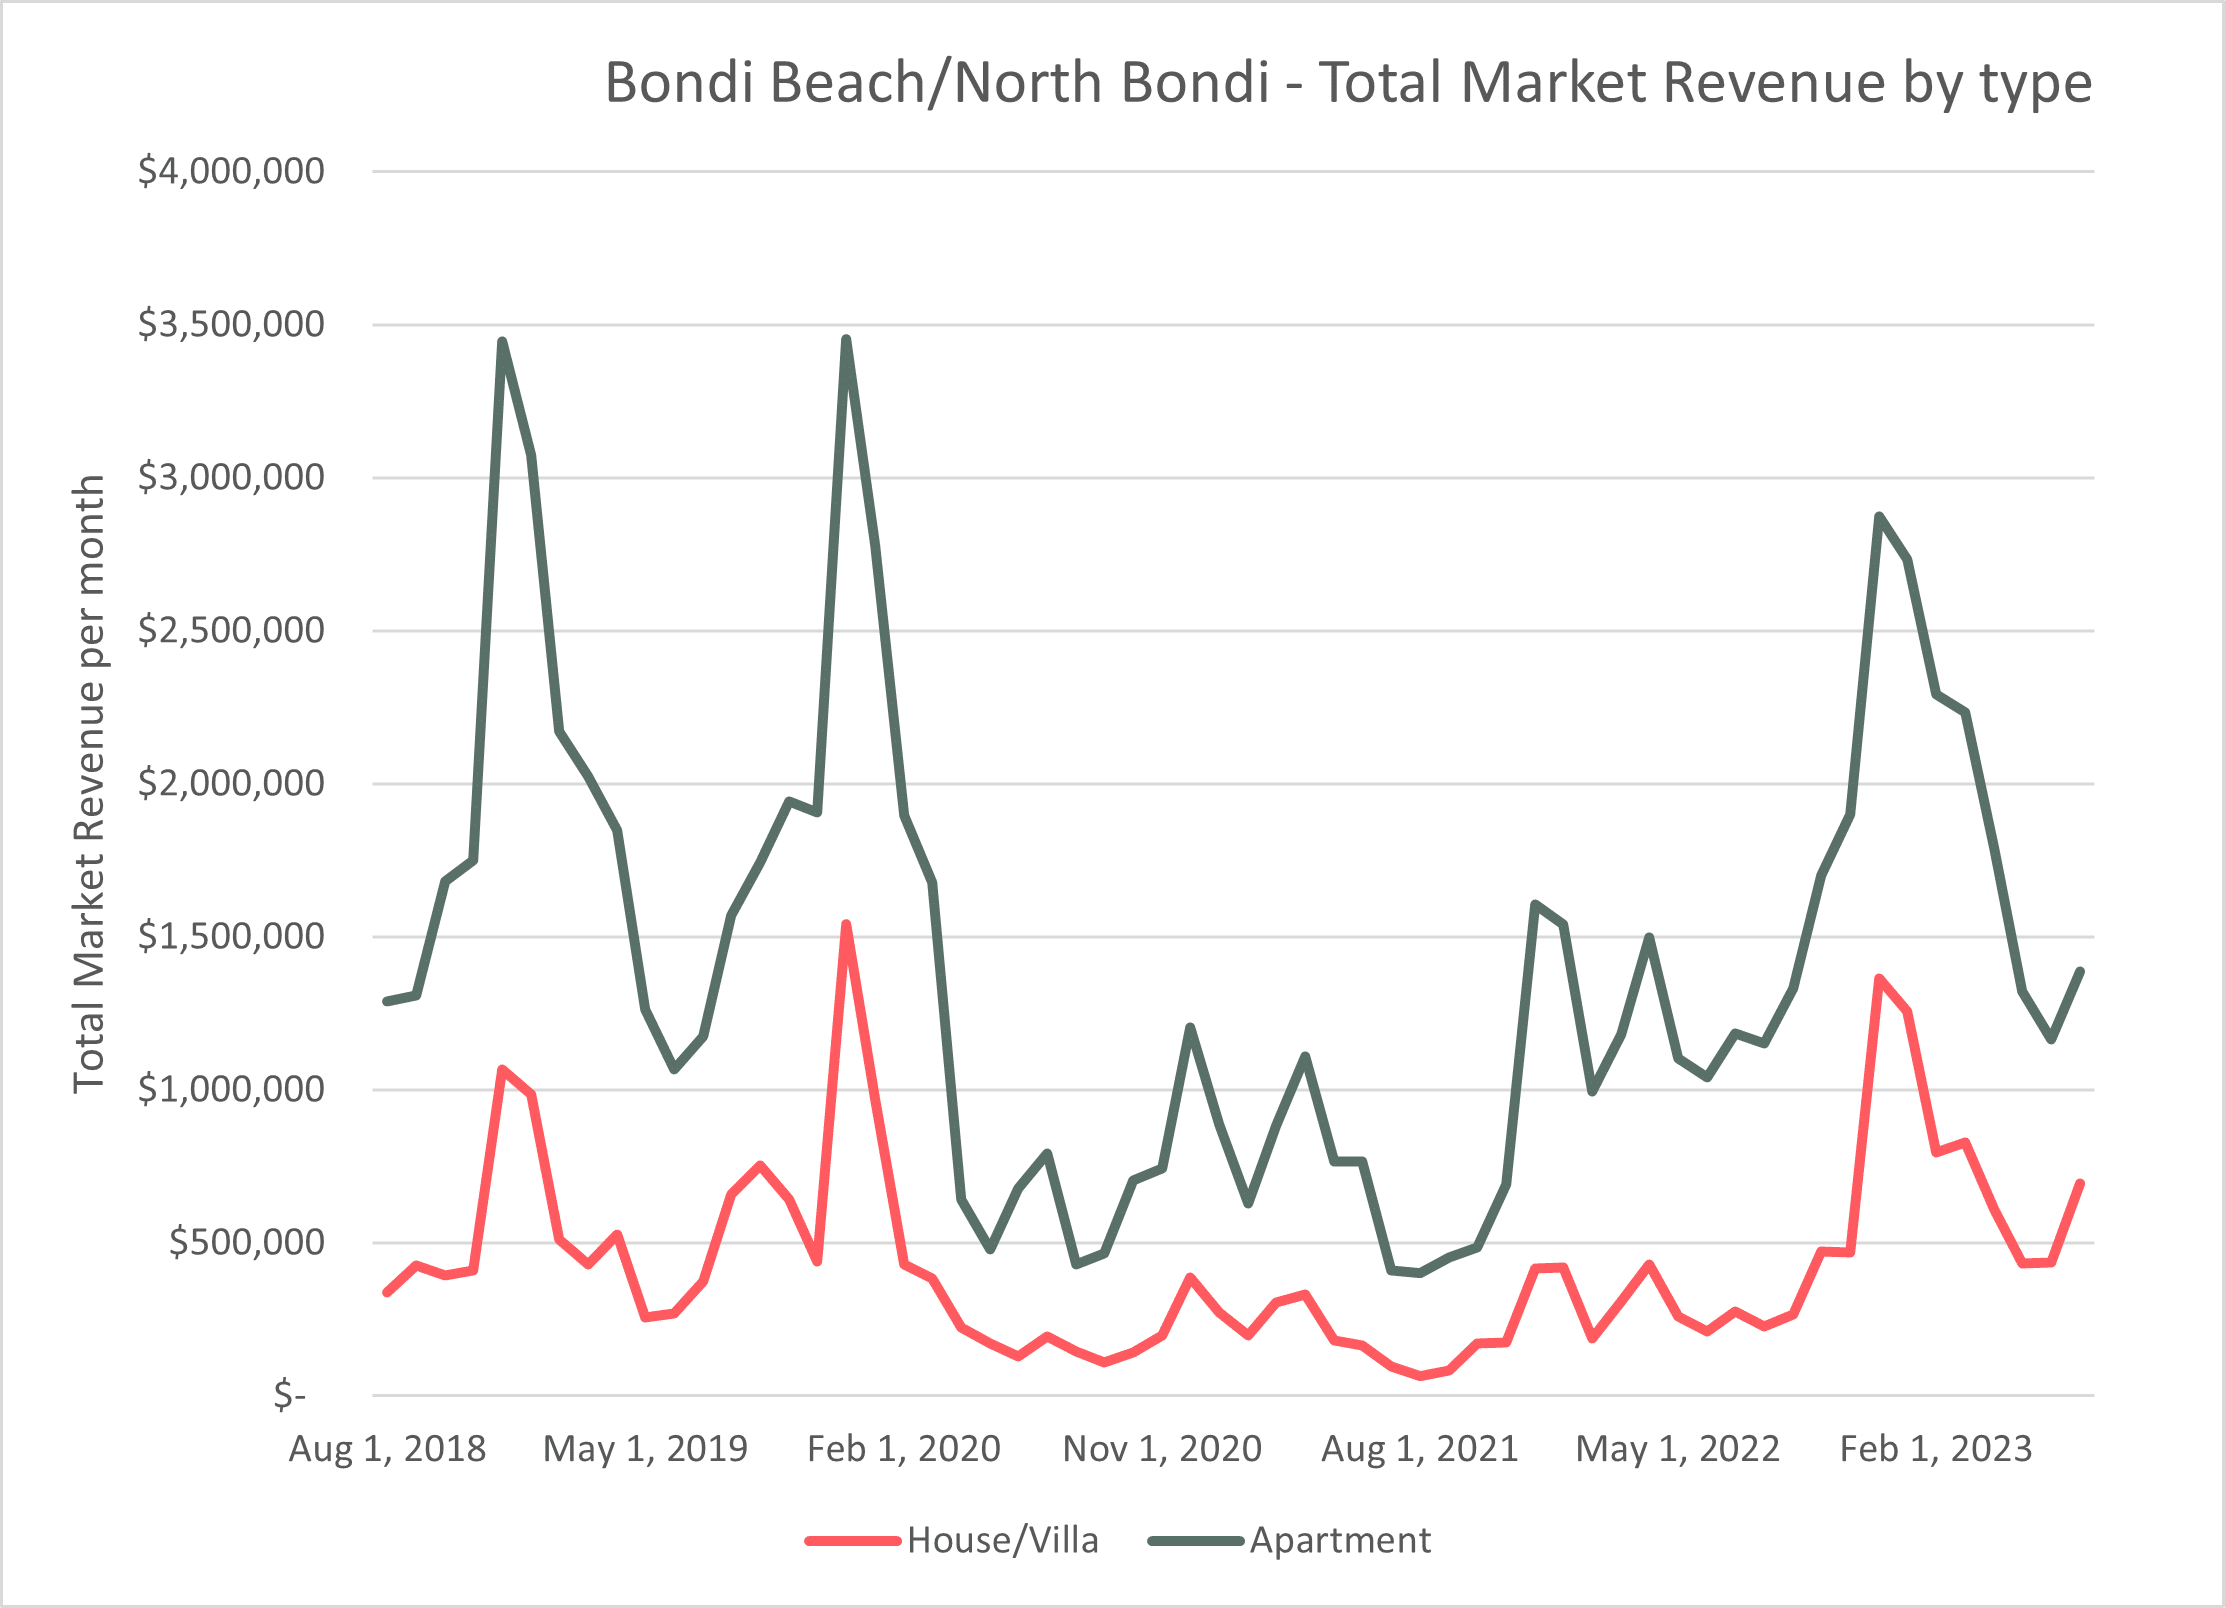
Market revenue continues to show improvement. The graph below shows the seasonality in the Bondi Beach market. The three big spikes (two pre-COVID) and one post-COVID are December 2018, December 2019, and December 2022. Summer, as expected, is an essential period for Bondi.
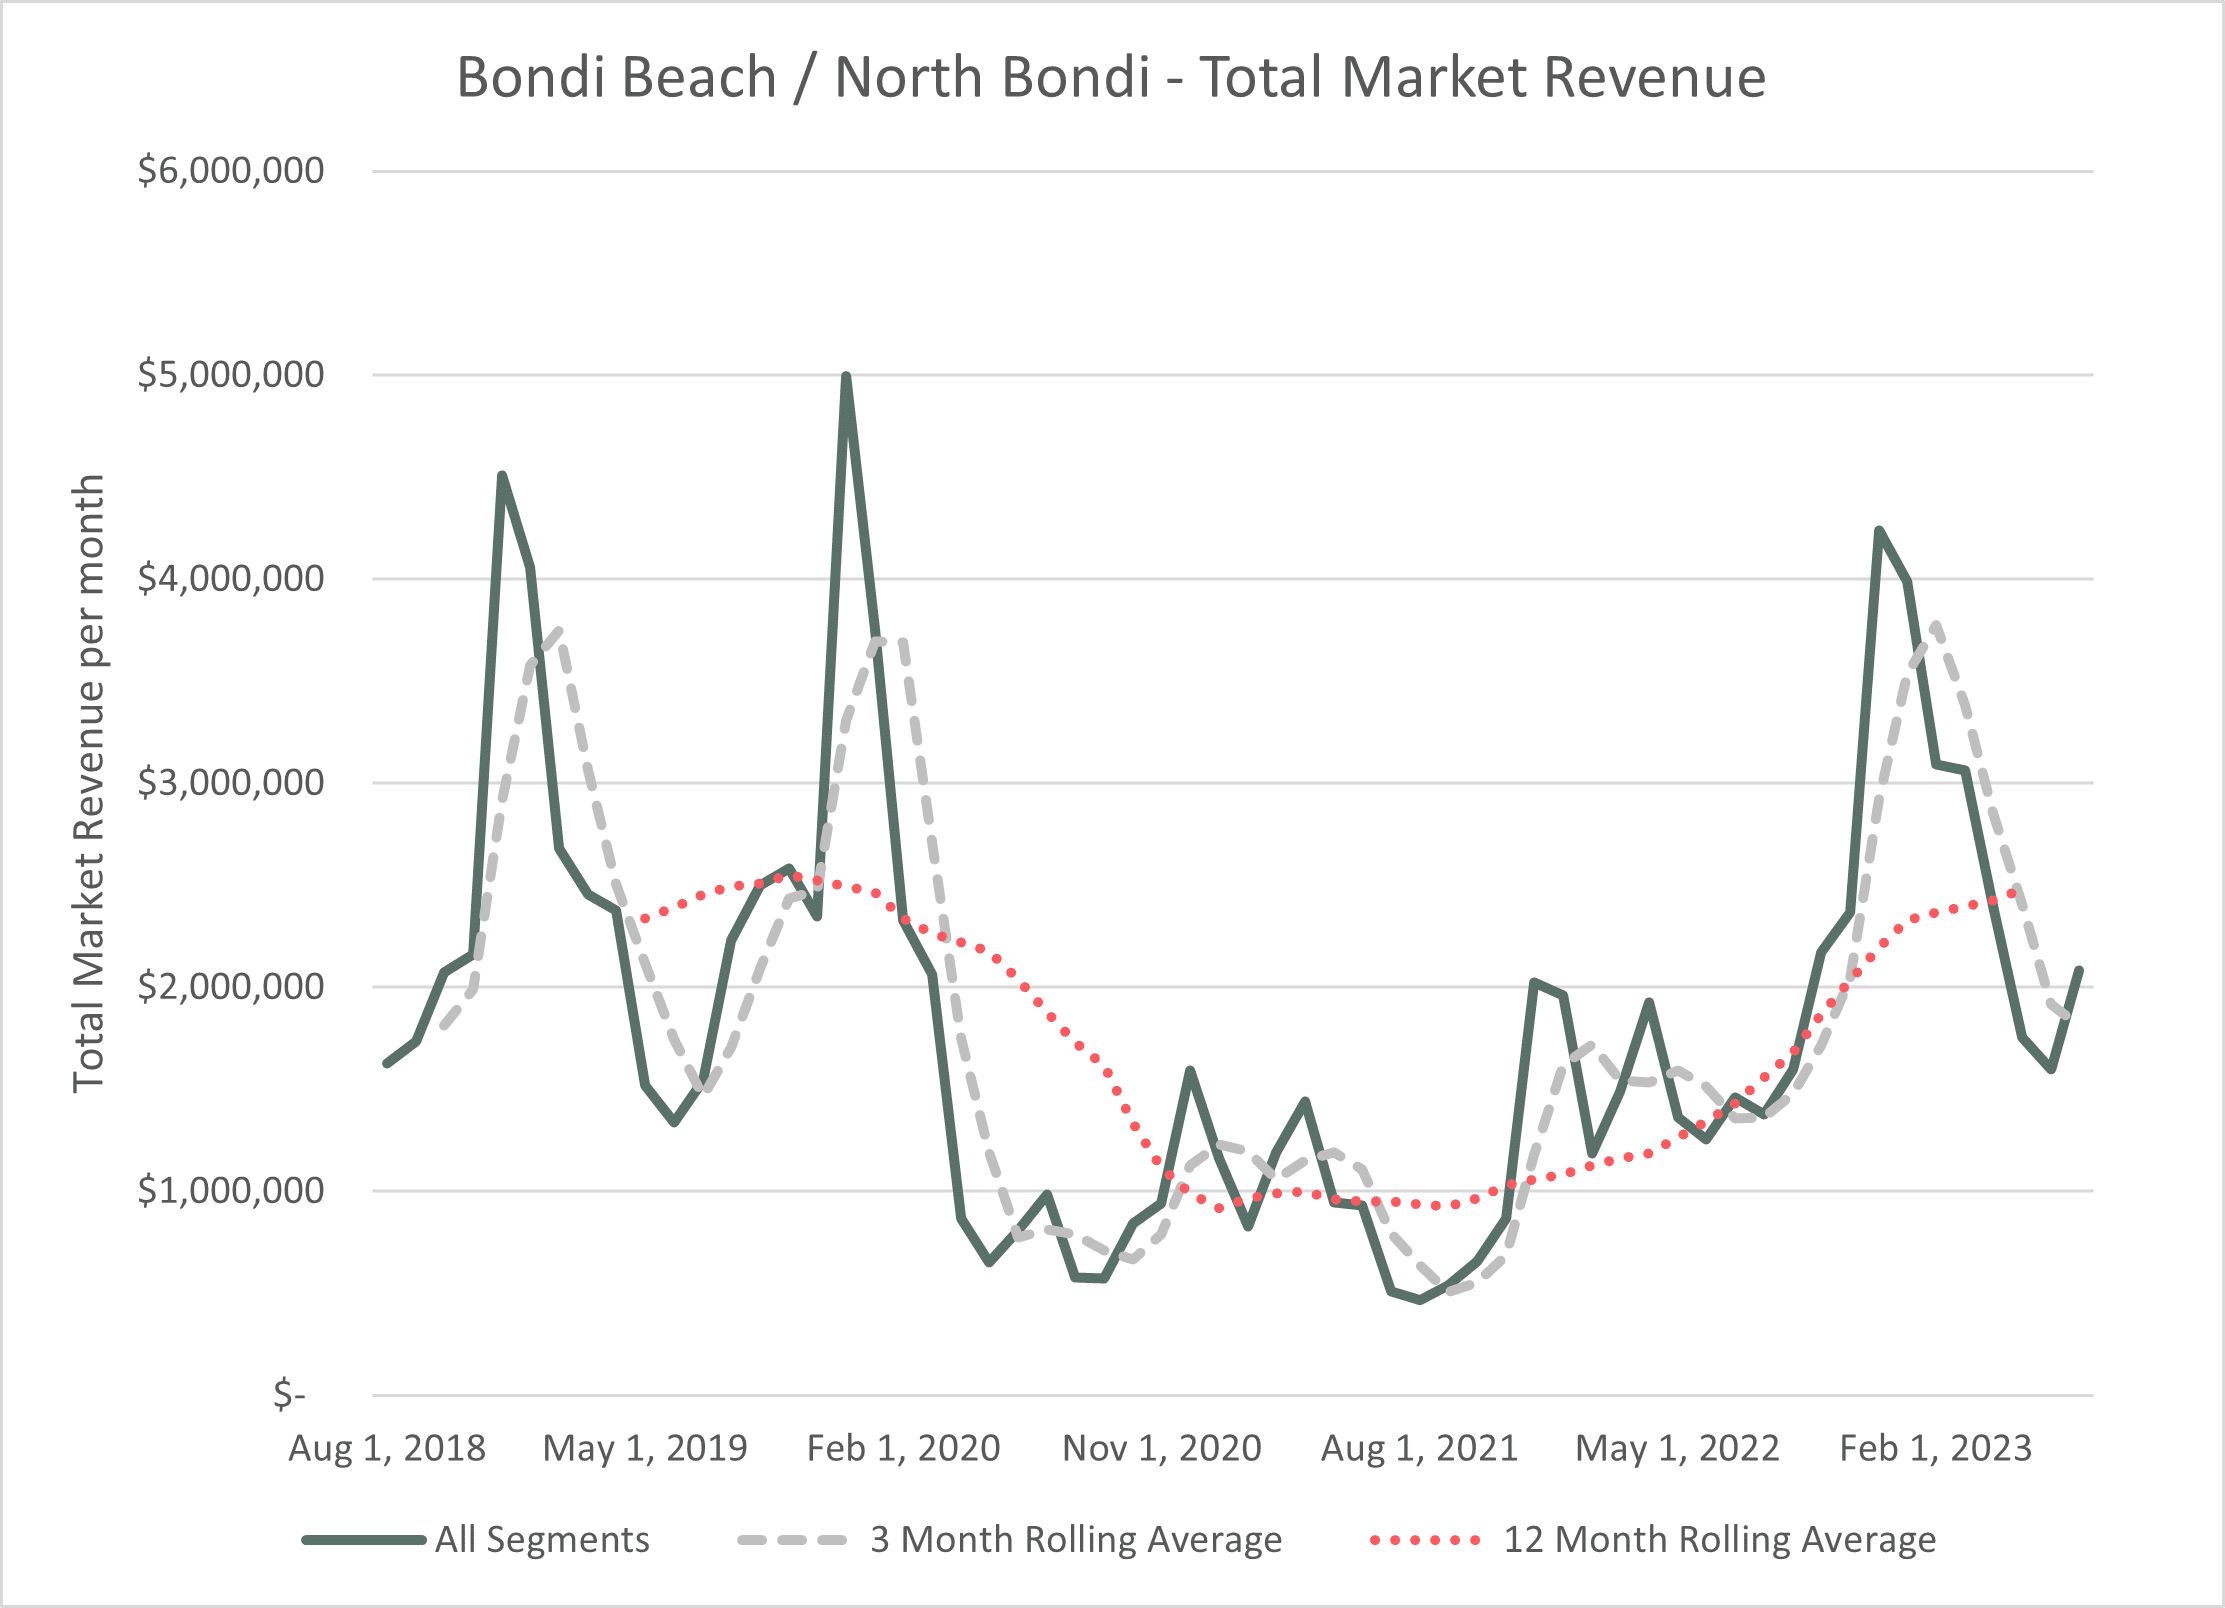
Source – AirDNA
The market is categorised into five quintiles: Budget, Economy, Mid-Scale, Upscale, and Luxury. The budget market has been the strongest performer in percentage terms over the last 12 months, up 187%, followed by economy (up 55%) and then Mid-scale, up 51%. The budget market is coming off a low base, so the best performer in dollar terms is the upscale market, which has seen an increase in market revenue of $139,342 for the year to $624,338.
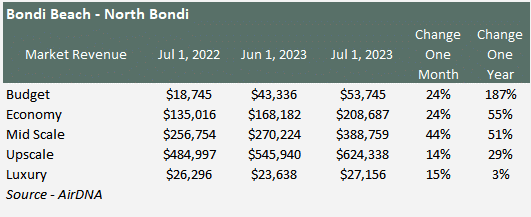
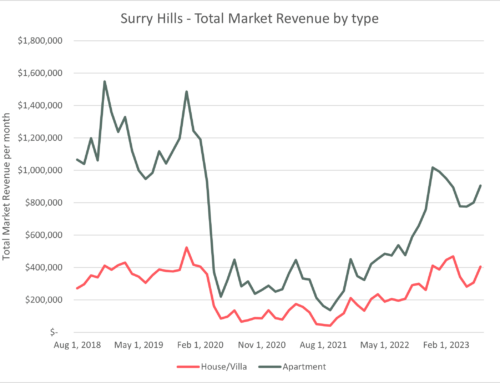
The Bondi market is predominantly driven by apartments, representing 67% of market revenue in July 2023. Apartment revenue showed growth of 17% over the last 12 months, with all these gains in the last month, with revenue up 19% since June. The trend is up and driven by a combination of improved occupancy and rates.
Source: AirDNA
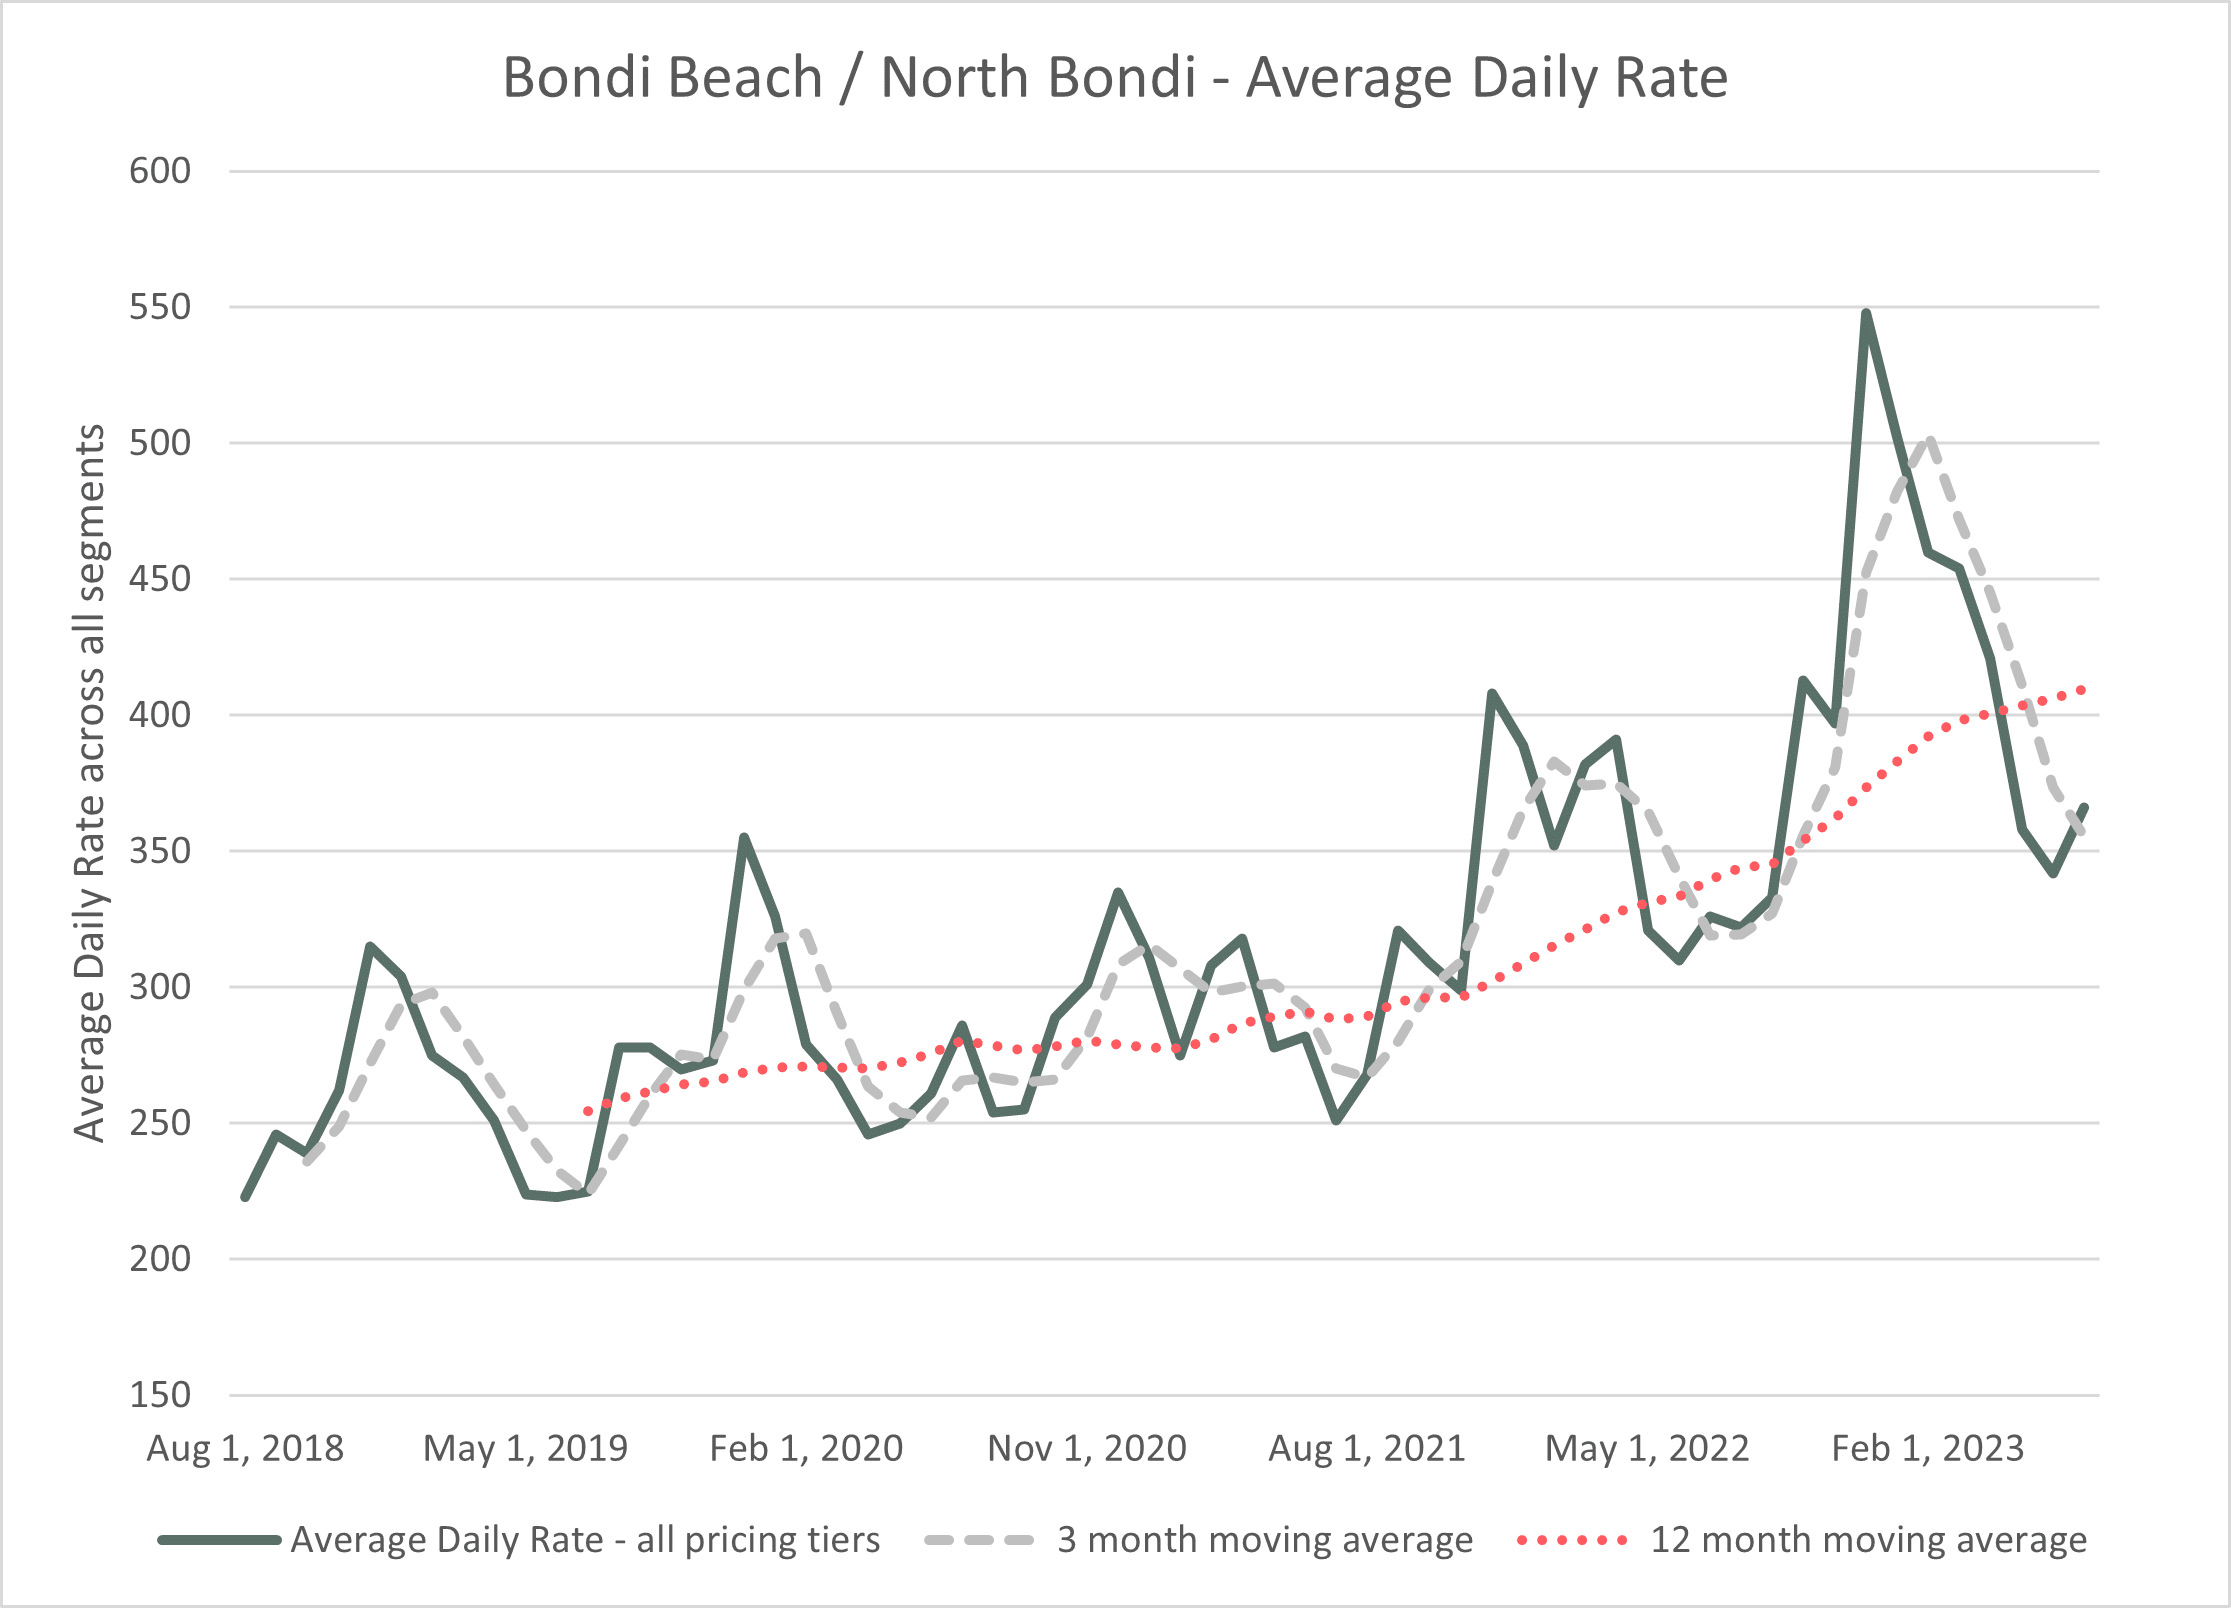
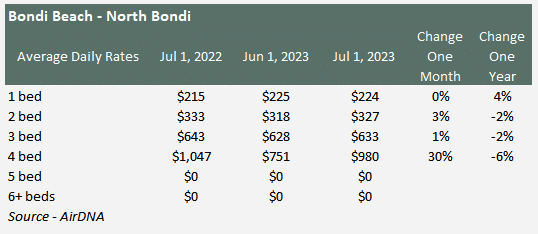
Average Daily Rates
Average daily rates continue to improve and are significantly higher than before COVID. The 3-month and 12-month trends continue to rise, and the 12-month trend is the highest in the history of AIRDNA’s data collection for Bondi Beach.
Source: AirDNA
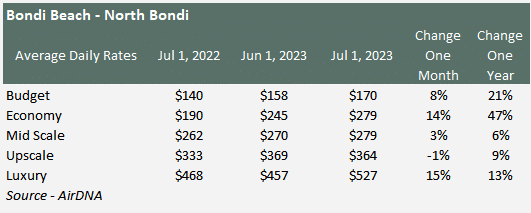
In the last 12 months, all segments have seen improvement in rates due to fewer active listings than before COVID, and an increase in short visitors from overseas. The lower budget and economy and luxury segments have seen double-digit growth in the last 12 months, although most of this growth has been achieved in the last month.
The 4-bedroom market saw a substantial rise in Average Daily Rates over the last month, up 30%, but there are only 32 properties in this segment, so the increase can be deceptive and is down on the rate 12 months ago. The largest segment is 1 bed with 220 properties, which has shown 4% growth over the last 12 months.
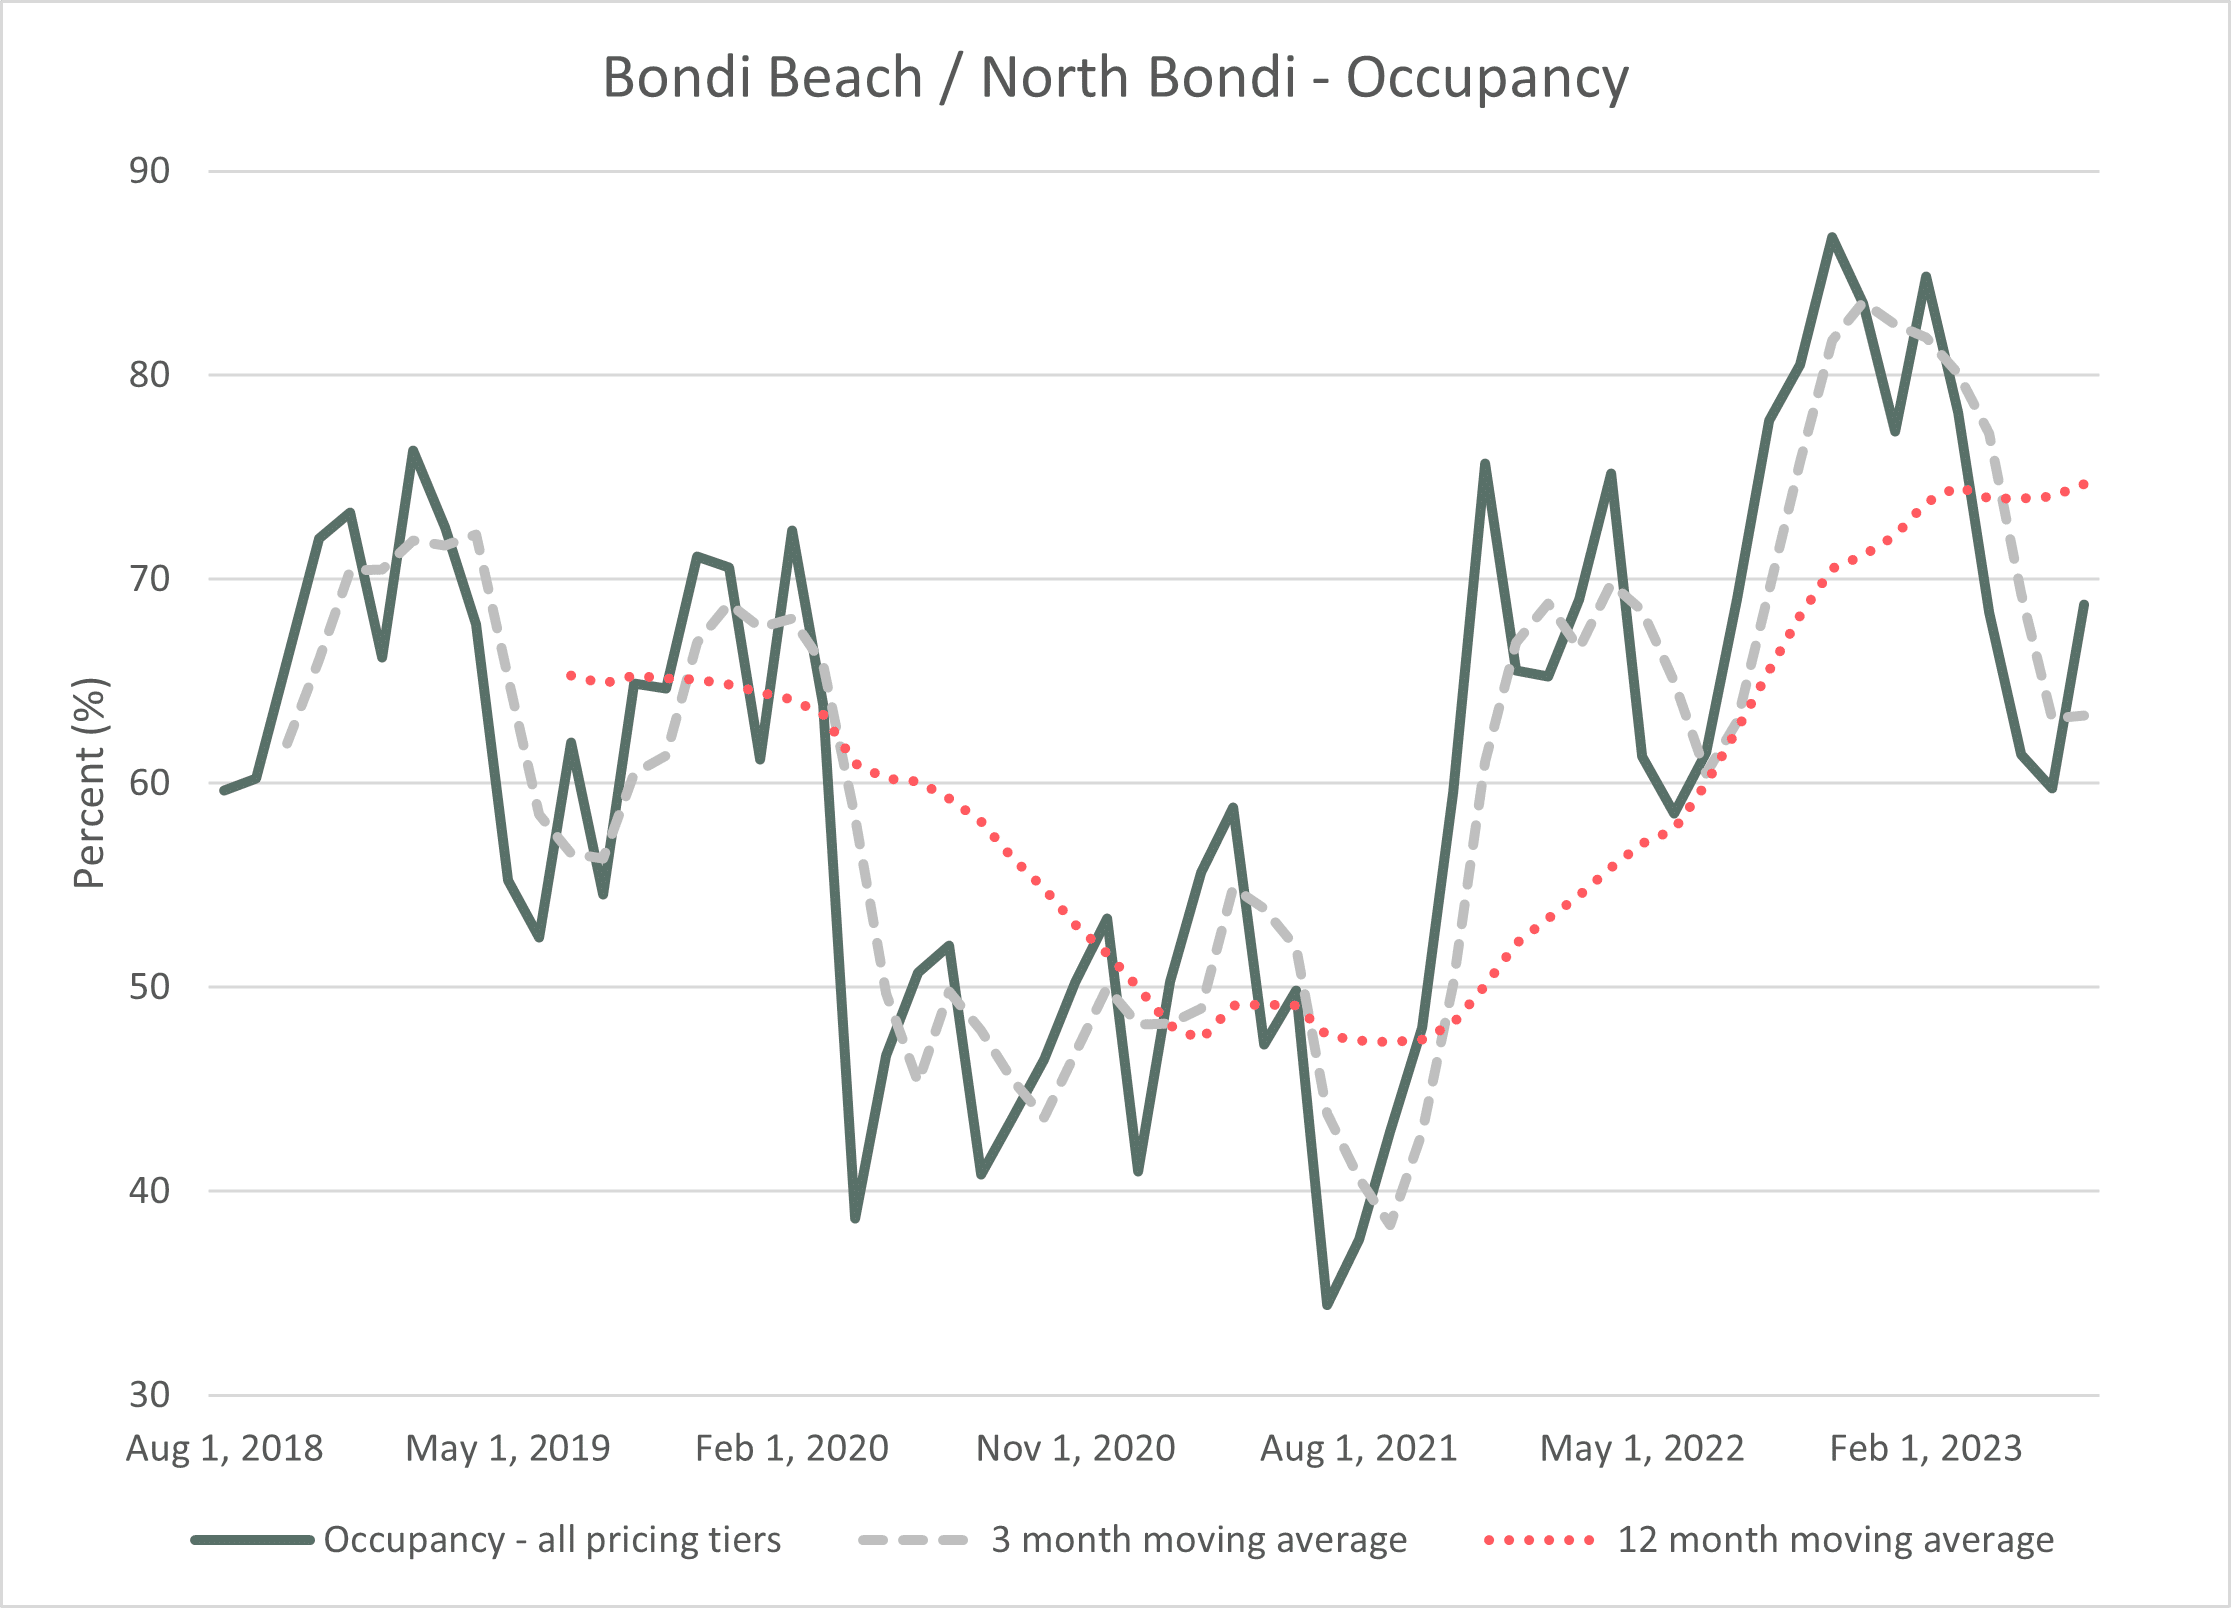
Occupancy
The actual occupancy number from AirDNA should be used sparingly, and it is best to focus on the trend rather than the actual number. As expected post-COVID, the trend has been strong, but as we can see, there has been some flattening in the 12-month trend, and the 3-month trend has dipped lower. This is most likely a function of seasonality, so it will be worth watching as we move towards summer.
Source: AirDNA
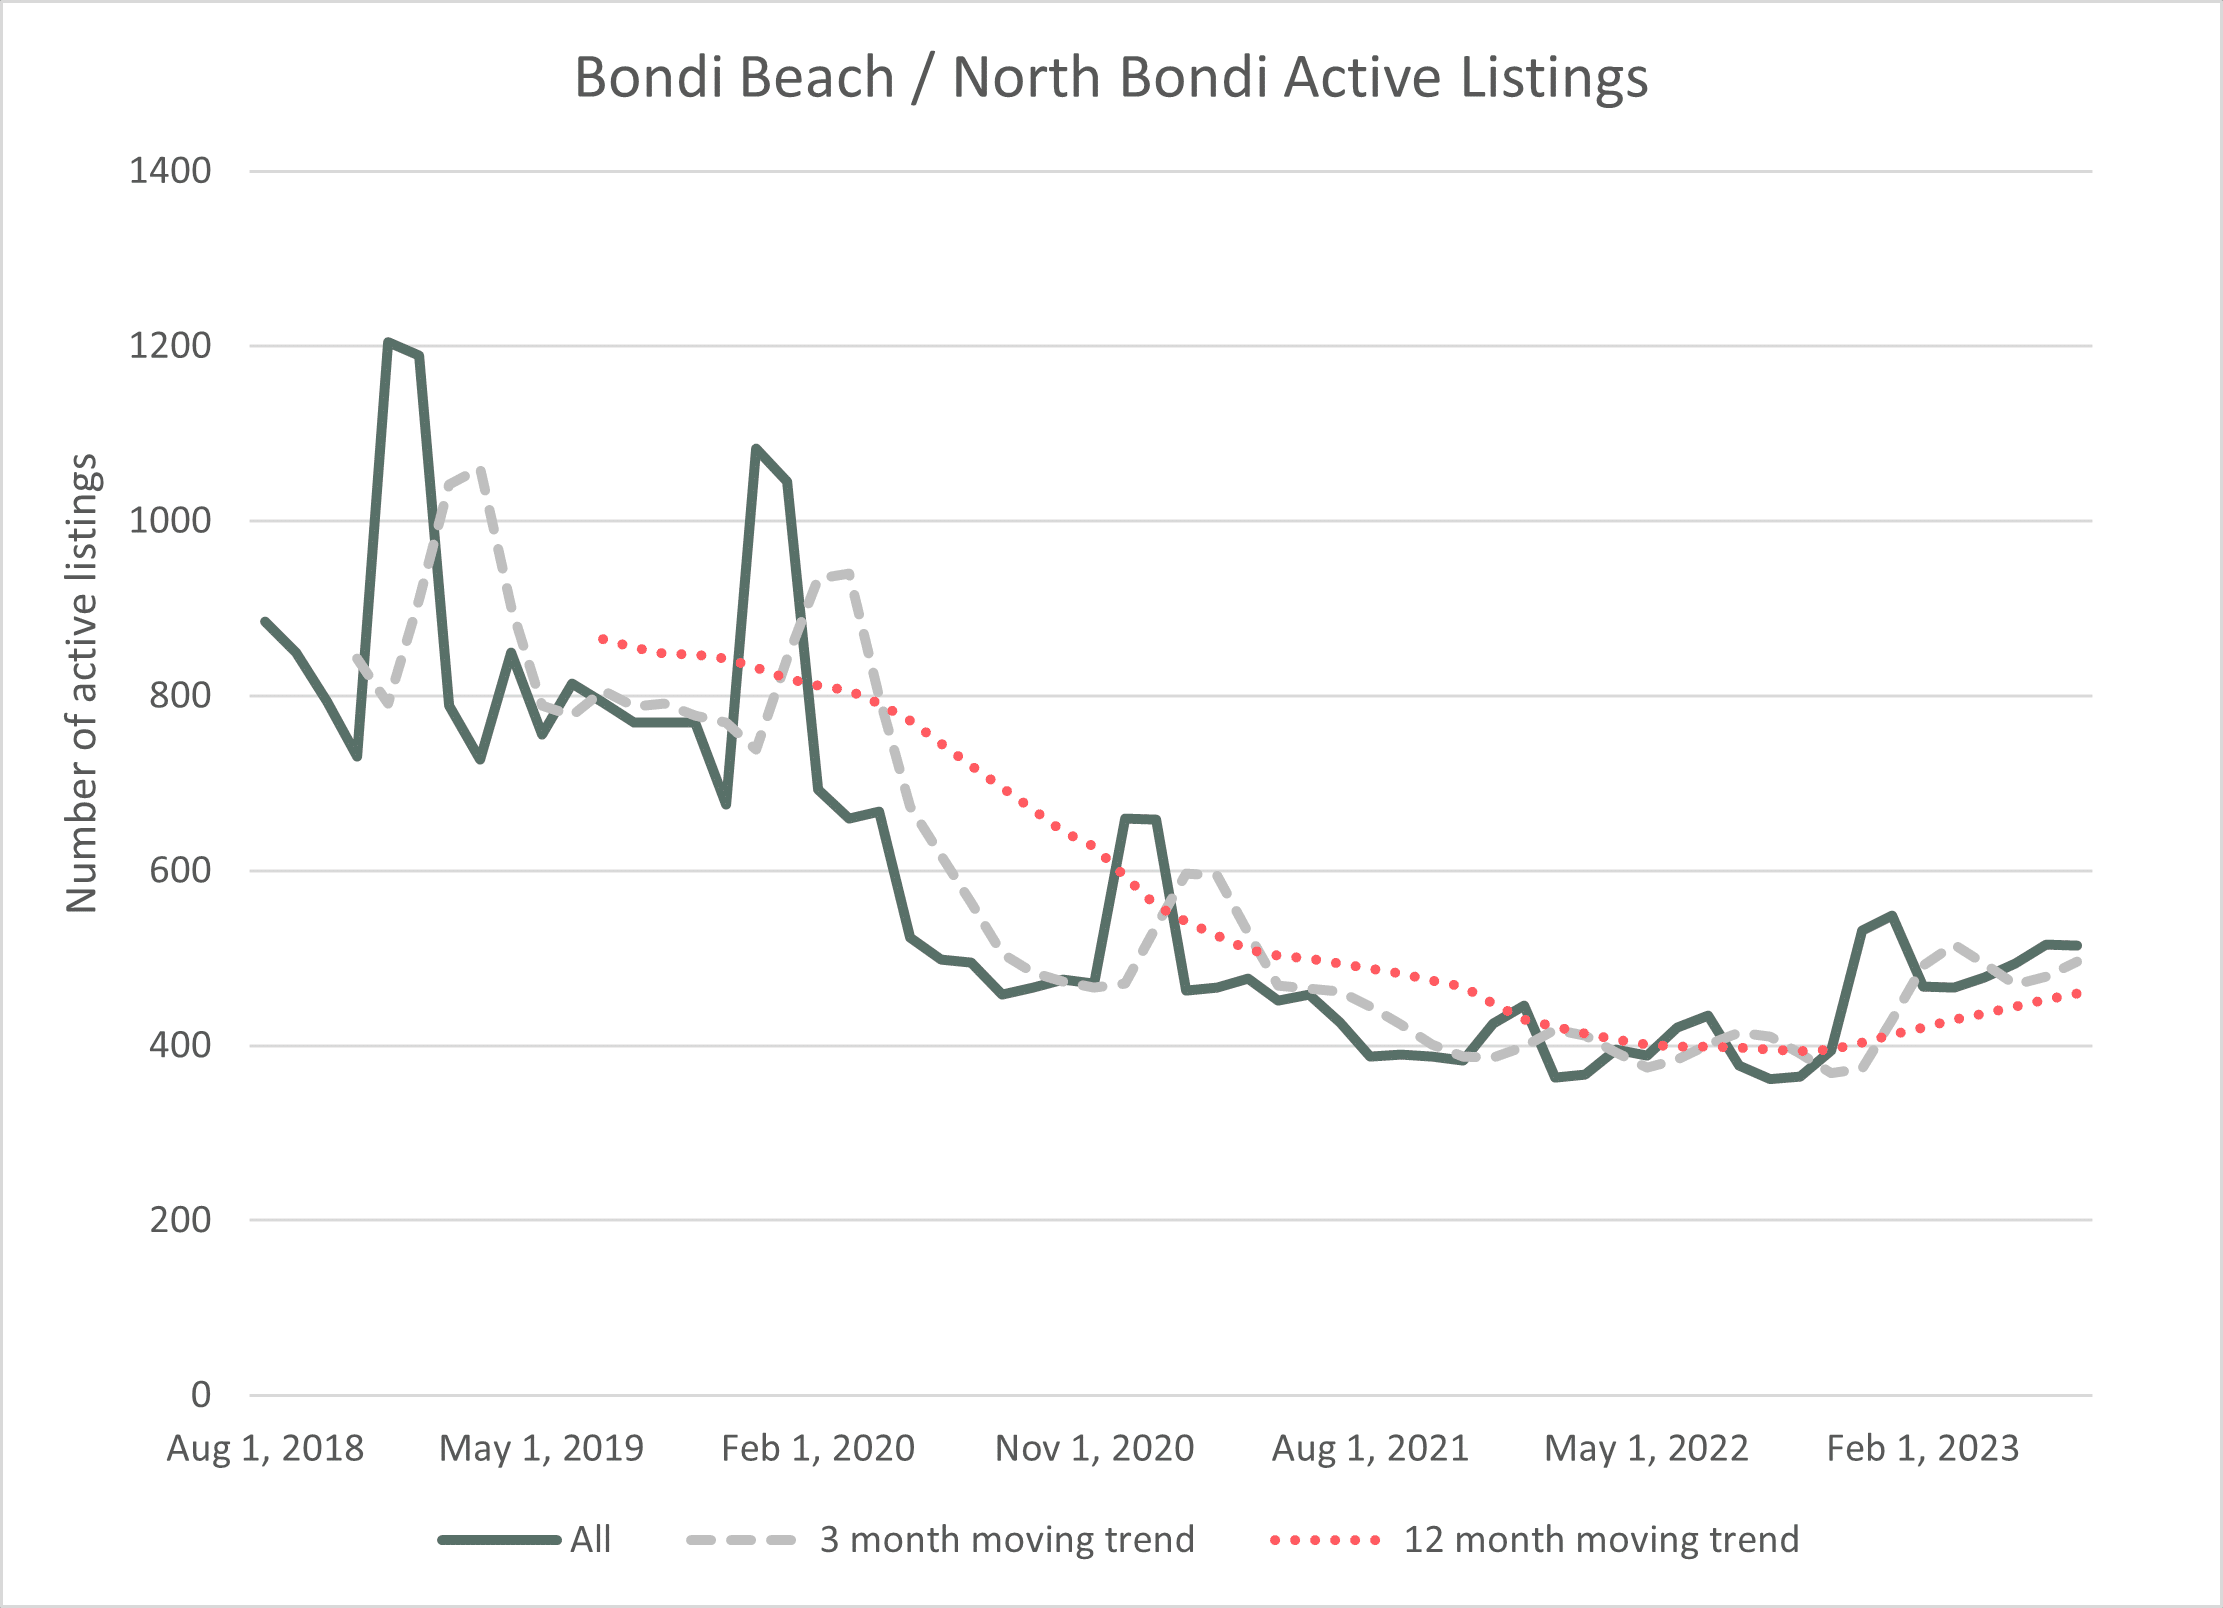
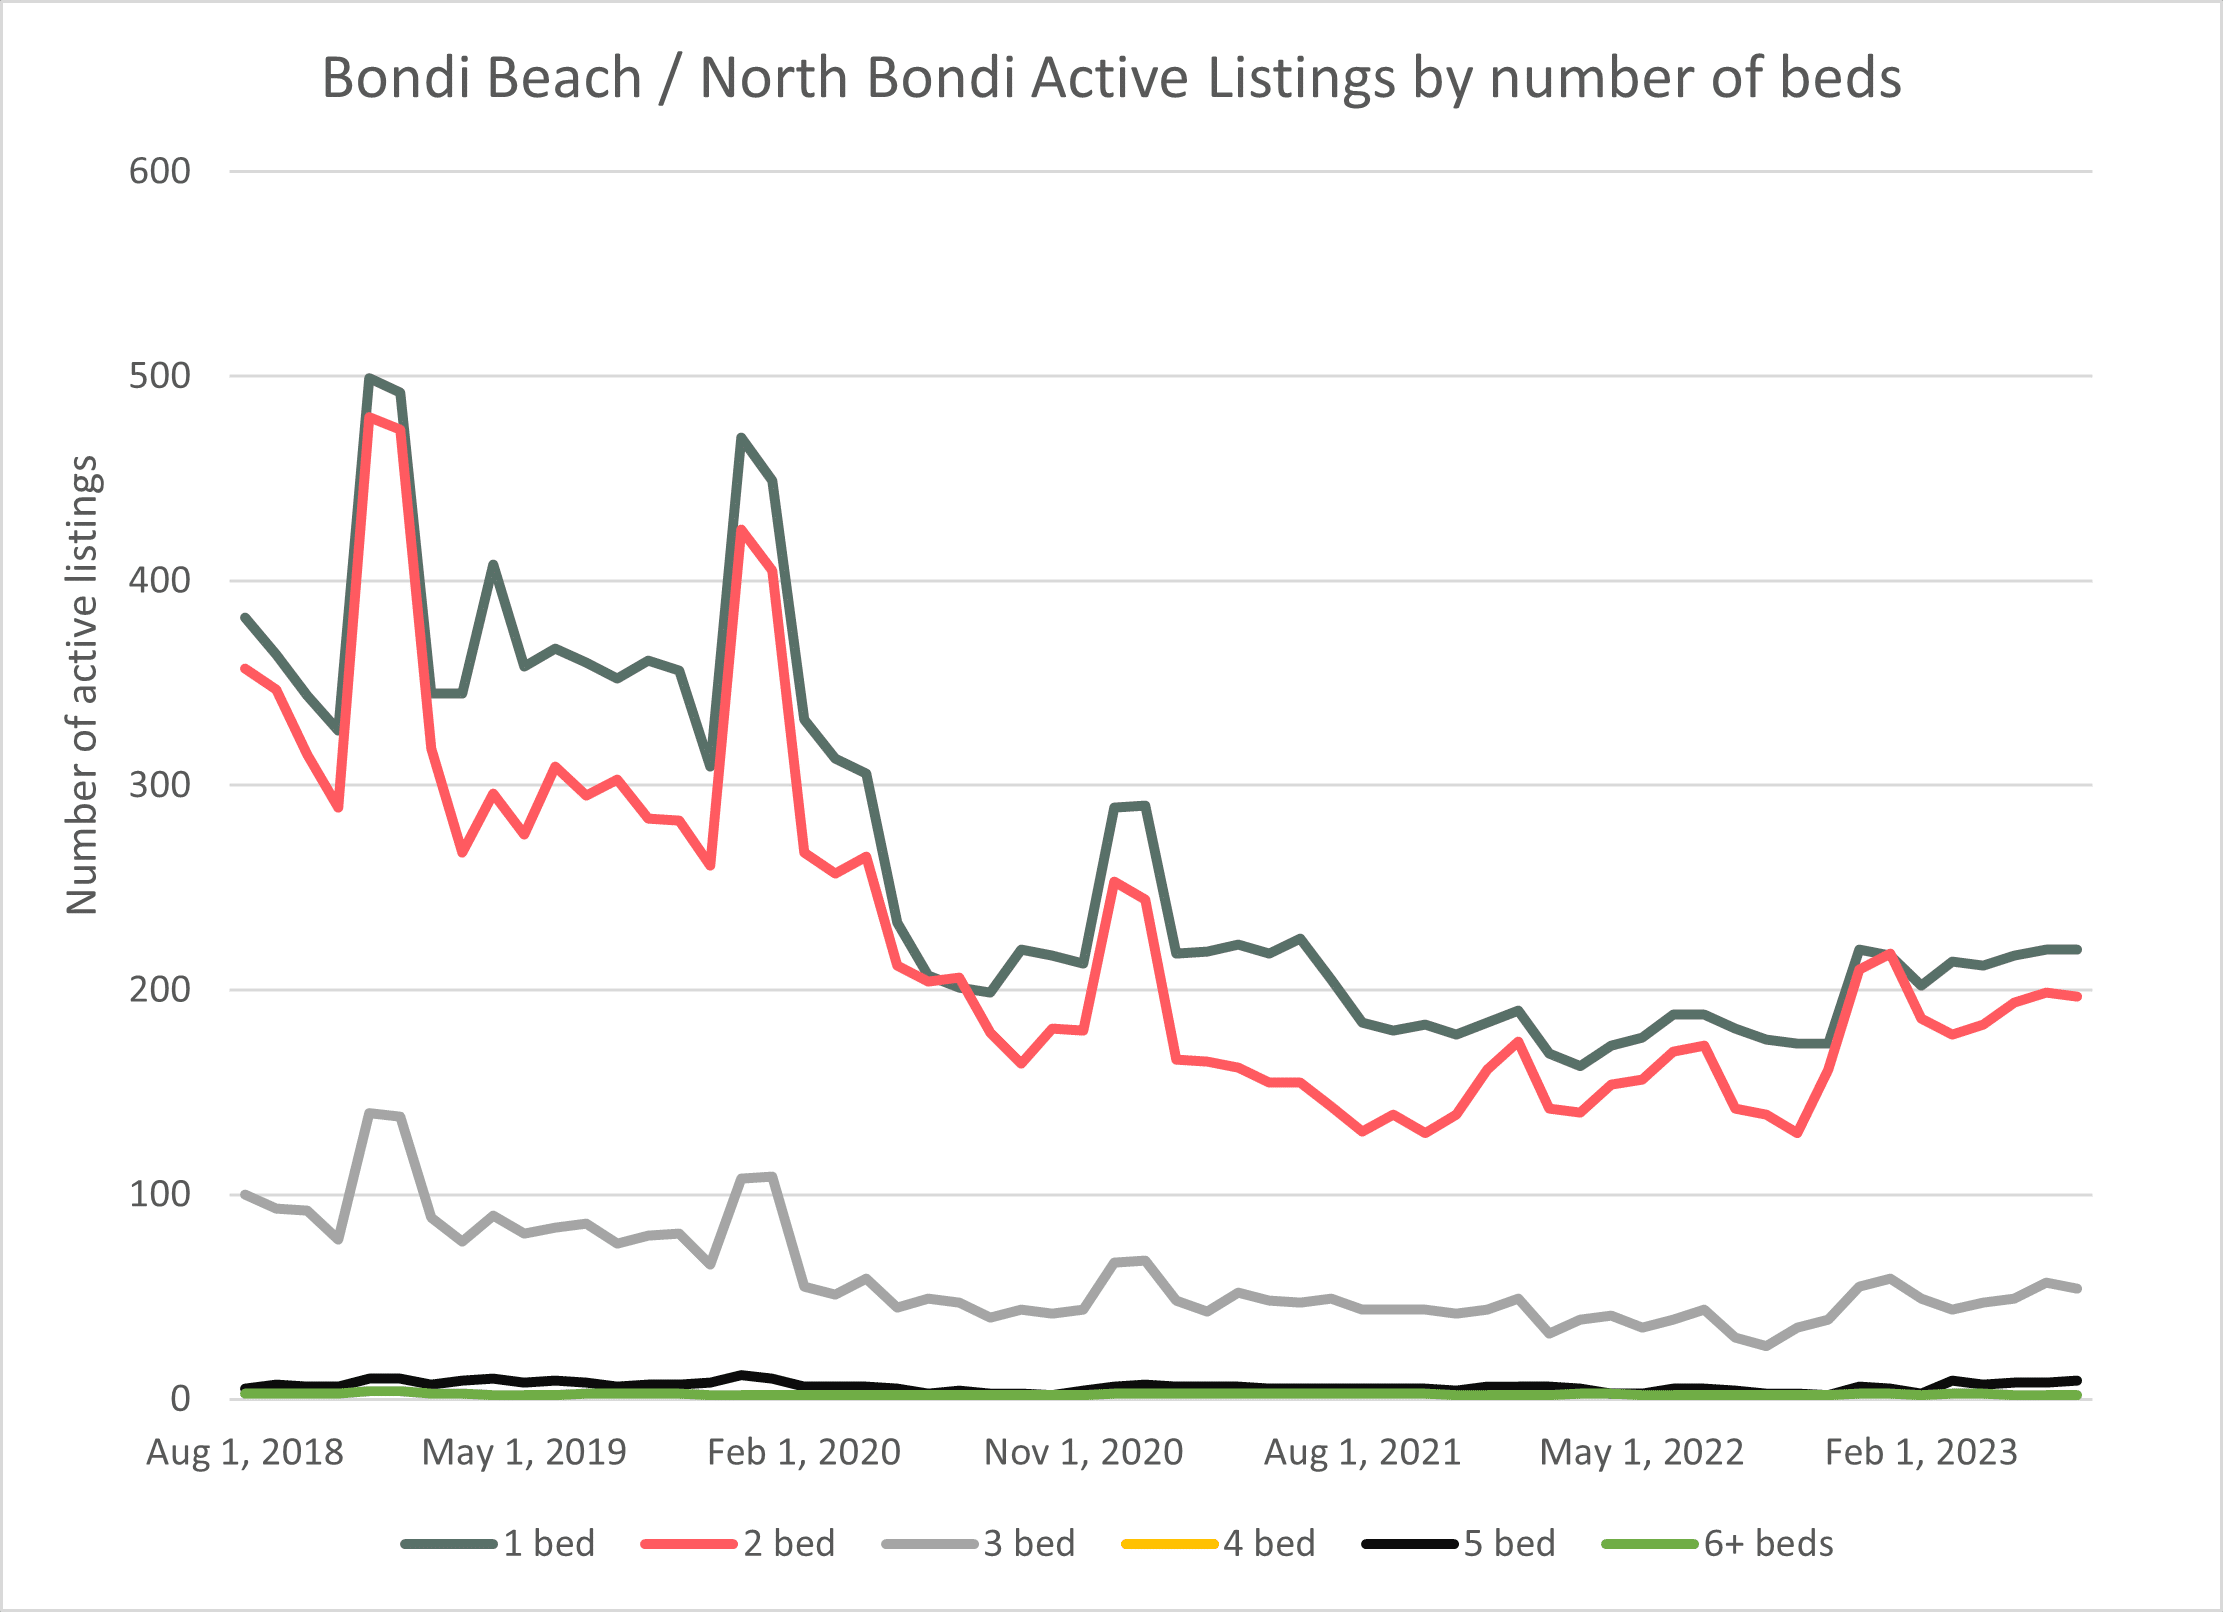
Active Listings
The improvement in occupancy and average daily rates you have seen already in the data have been helped significantly by the significant drop in active properties post-COVID. The total number of active listings peaked in December 2018 at 1205; in July 2023, the number of active properties was 514, 57% lower. The trend is up from the low of 362 in September 2022.
Source:AirDNA
The retraction in active properties was across all bed types; however, the number of new active listings post-COVID has been in the 1-bed and 2-bed markets, up 32 and 24 active properties, respectively.
Source:AirDNA
Talk to HomeHost about managing your property in Surry Hills. Call today on 1300 171 718.
AIRDNA Terms
Active Listing Nights – Count of nights within a given period that are not blocked and are either reserved or available as long as there has been a reservation within the last 28 days.
Active – Active vacation rentals are those that had at least one calendar day classified as reserved or available during the reporting period.
Available Listings – Total number of listings whose calendars had at least one day classified as available or reserved during the reporting period.
Average Daily Rate (Native) – Average daily rate (ADR) of booked nights in USD. ADR = Total Revenue / Booked Nights. Includes cleaning fees.
Market Revenue – Total revenue generated in a segment for that period.
Occupancy Rate – Occupancy Rate = Total Booked Days / Active Listing Nights
See the full list of definitions here.
Need expert Airbnb Management?
Talk to Home Host – call 1300 171 718.