Source AirDNA
Surry Hills, with its proximity to the city, sporting stadiums, nightlife, and tourist attractions, remains a prime market. A breakdown of the properties in Surry Hills reveals:
- 73% are entire homes.
- 23% are private rooms.
- 3% are shared rooms.
- 57% of the rentals are 1-bedroom properties.
- The average rating stands at 4.57, with 61% of properties rated 4.5 or higher.
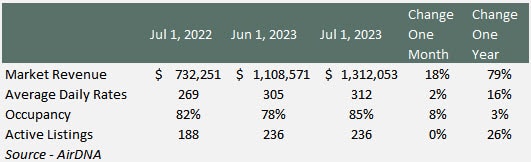
Post-COVID, the Surry Hills Airbnb market is on the rebound:
- Market revenue surged by 79% over the past year, fuelled by the resurgence of short-term visitors to NSW and Australia.
- Average daily rates climbed by 16% in the same period.
- Occupancy rates remain steady at 85%. However, this metric might be influenced by how it’s measured, considering many properties were delisted during COVID-19.
- Total listings have grown by 26% in the last year but are well down on pre-COVID levels.
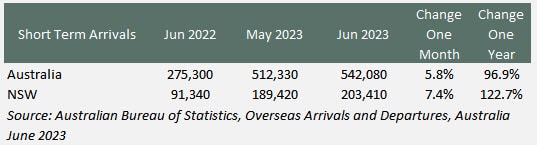
Short-Term Visitors to Australia
The primary catalyst for the uptick in bookings is the surge in short-term visitors to both Australia and NSW. Over the past year, tourist arrivals have soared by 96.9% for Australia and 122.7% for NSW. However, the growth rate moderated to single digits from June to July.
Interest Rates
In conjunction with the rise in short-term visitors to Australia, there has been a significant rise in interest rates. Discounted Variable Home Loan rates were at a low from August 2021 to April 2022 at 3.45%, rising to 7.06% in June 2023.
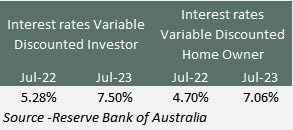
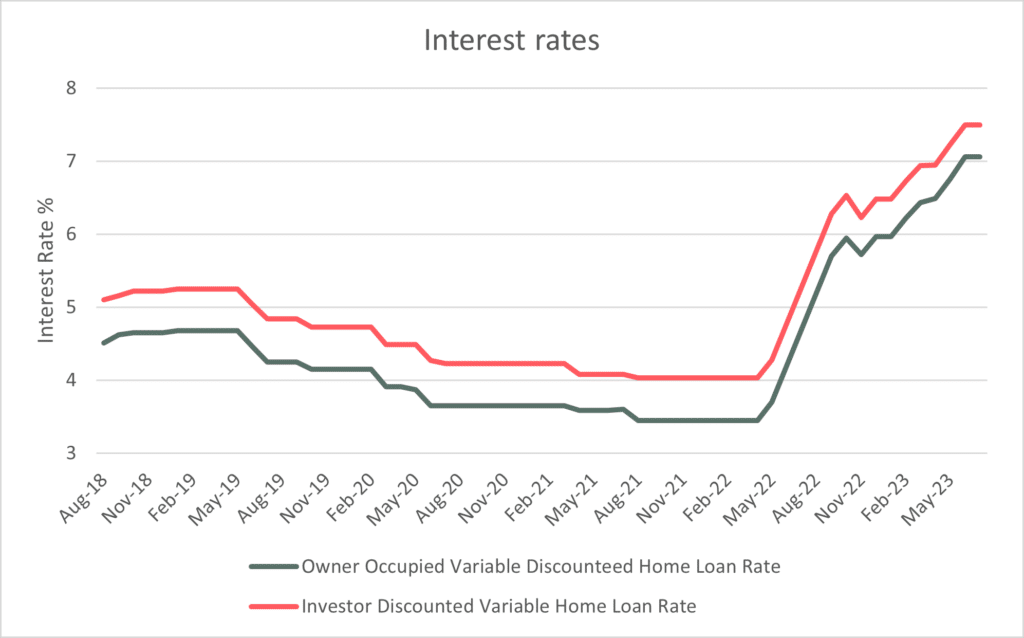
Source – Reserve Bank of Australia
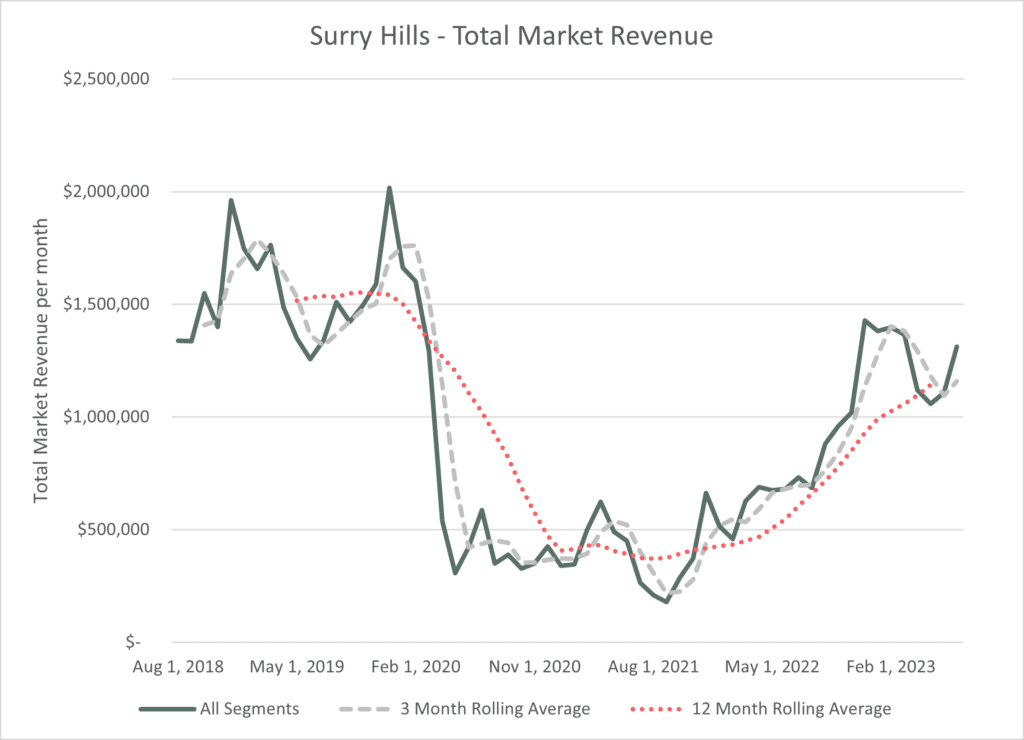
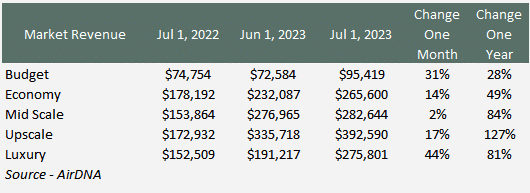
Market Rates
Market revenue continues to show good momentum in both the three-month rolling average and the 12-month rolling average. The three-month average has just dipped below the 12-month average for the first time since July 2021.
Source – AirDNA
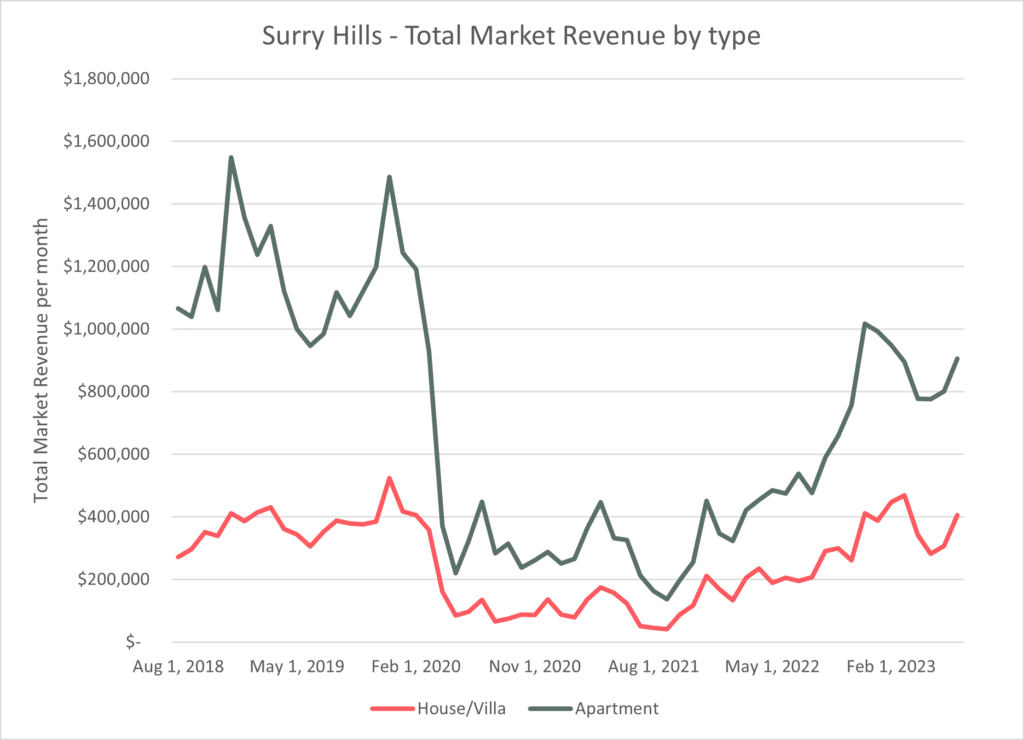
The market is categorized into five quintiles: Budget, Economy, Mid-Scale, Upscale, and Luxury. All segments have witnessed growth, but the top three tiers have seen the most significant increases, ranging from 81% to 127% over the past year. Notably, the luxury segment grew by 44% in the last month.
The post-COVID surge was initially led by apartments. However, recent gains in the luxury market might be attributed to a 109% spike in market revenue, with a 32% increase in the past month. Apartment market revenue has risen by 79% year-on-year and 18% month-on-month.
Source – AirDNA
Average Daily Rates
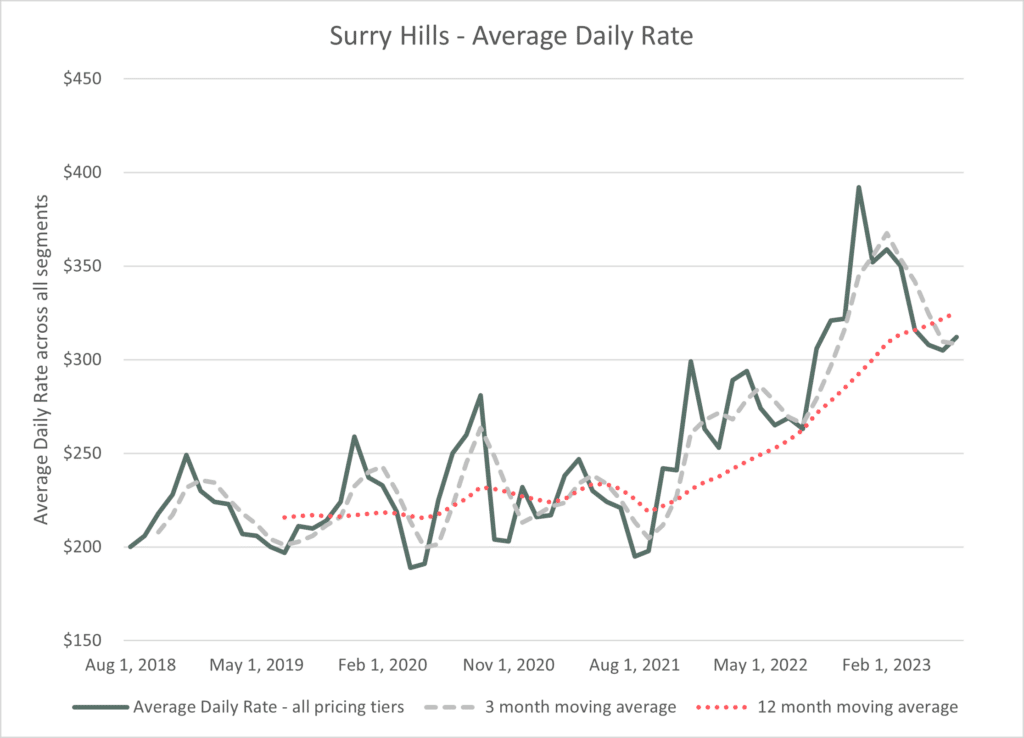
Average daily rates continue to improve and are now significantly higher than before COVID. The 3 month and 12-month trends continue to rise.
Source – AirDNA
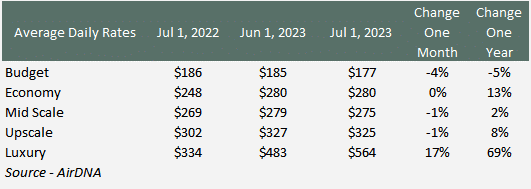
The change in the luxury segment appears to be mostly derived from an increase in daily rates. The luxury market rose 69% in the last 12 months while most other segments saw small changes in comparison.
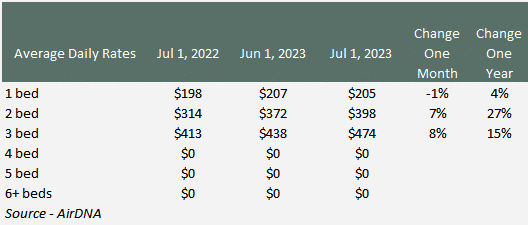
Most of these increases will be in the 2 and 3-bedroom segments. The two bed rose the fastest, up 27% in the last 12 months, and 3 bed 15%.
Occupancy
The actual occupancy number you see from AirDNA should be used sparingly and best to focus on the trend rather than the actual number. The trend has been strong as expected post COVID but as we can see there has been some flattening in the 12-month trend and the 3 month trend has dipped lower. This is most likely a function of seasonality so it will be worth watching as we move towards summer.
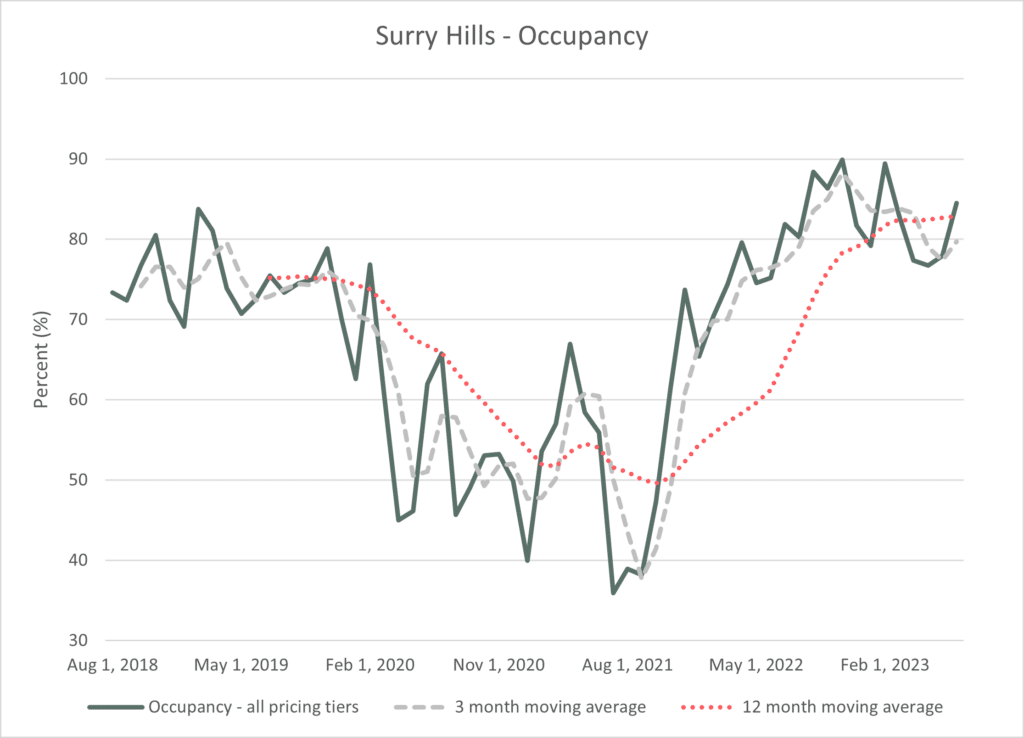
Source – AirDNA
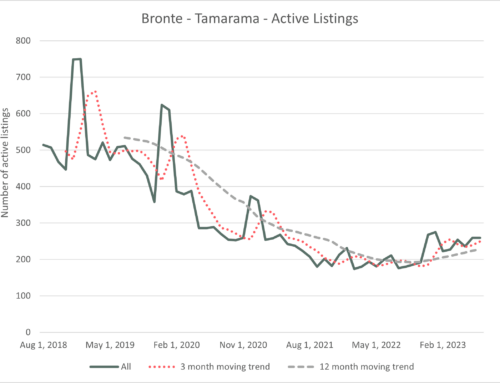
Active Listings
A key component of AIRBNB success other than demand is the supply of available properties in the market. We have seen above the strong increase in daily rates well above those in 2018 and this is likely a function of the significant fall in active properties listed on AIRBNB. January 2019 was the peak with 561 properties listed on AIRBNB and this is now sitting in July 2023 at 236.
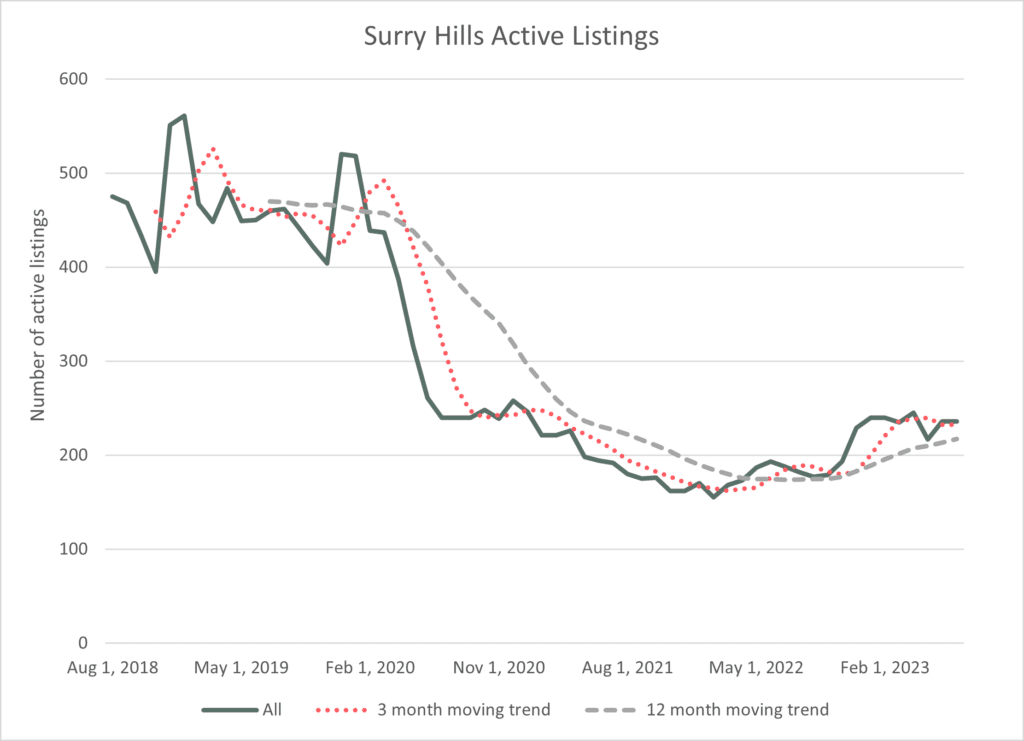
Source – AirDNA
The large drop came from 1 bed properties from a high of 344 to 146 in July 2023, although all bed types saw drops in the number of properties.
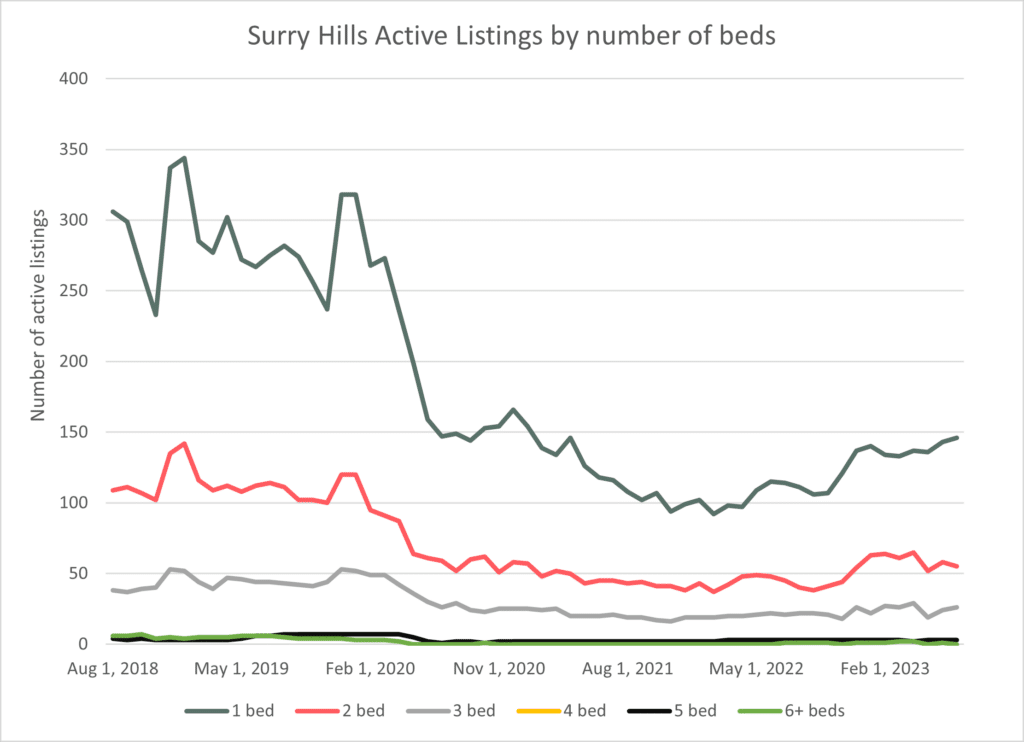
Source – AirDNA
Talk to HomeHost about managing your property in Surry Hills. Call today on 1300 171 718.
AIRDNA Terms
Active Listing Nights – Count of nights within a given period that are not blocked and are either reserved or available as long as there has been a reservation within the last 28 days.
Active – Active vacation rentals are those that had at least one calendar day classified as reserved or available during the reporting period.
Available Listings – Total number of listings whose calendars had at least one day classified as available or reserved during the reporting period.
Average Daily Rate (Native) – Average daily rate (ADR) of booked nights in USD. ADR = Total Revenue / Booked Nights. Includes cleaning fees.
Market Revenue – Total revenue generated in a segment for that period.
Occupancy Rate – Occupancy Rate = Total Booked Days / Active Listing Nights
See the full list of definitions here.
Need expert Airbnb Management?
Talk to Home Host – call 1300 171 718.