Source: AirDNA
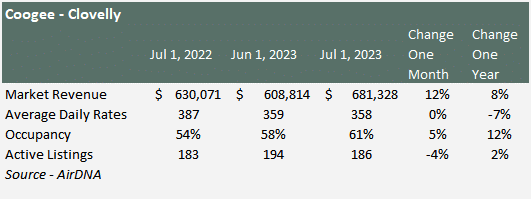
Situated a stone’s throw away from the bustling city of Sydney, Coogee and Clovelly stand as jewels of the eastern suburbs, offering travellers a harmonious blend of beachside serenity and metropolitan accessibility. With their captivating beaches, ocean pools, and renowned coastal walks, these adjacent suburbs have become hotspots for Airbnb enthusiasts, mirroring their escalating allure among global travellers. As of July 2023, Coogee and Clovelly proudly showcased a total of 186 active properties in July 2023 on Airbnb. A deeper dive into the data reveals the following intriguing insights about the Coogee and Clovelly market:
- 85% are entire homes.
- 15% are private rooms.
- 39% of the rentals are 1-bedroom properties.
- 34% of the rentals are 2-bedroom properties
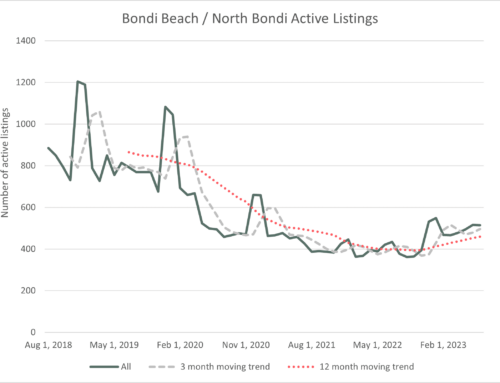
Post-COVID, the Bondi Beach / North Bondi Airbnb market is on the rebound:
- Market revenue has been sedate over the last 12 months, rising just 8% despite the resurgence of short-term visitors to NSW and Australia.
- Average daily rates fell 7% in the same period.
- Occupancy rates have risen marginally by 12% from 54% top 58%.
- Total listings have grown only2% in the last year but are down on pre-COVID levels of the January 2019 peak of 527 properties by 65%.
The data would suggest that the more you move away from the core AIRBNB activity in Bondi Beach the relative recovery is slower.
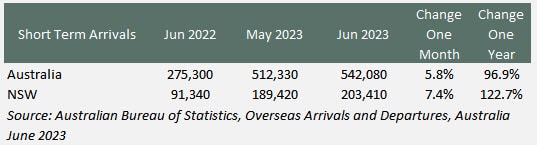
Short-Term Visitors to Australia
The primary catalyst for the uptick in bookings is the surge in short-term visitors to both Australia and NSW. Over the past year, tourist arrivals have soared by 96.9% for Australia and 122.7% for NSW. However, the growth rate moderated to single digits from June to July.
Interest Rates
In conjunction with the rise in short-term visitors to Australia, there has been a significant rise in interest rates. Discounted Variable Home Loan rates were at a low from August 2021 to April 2022 at 3.45%, rising to 7.06% in June 2023.
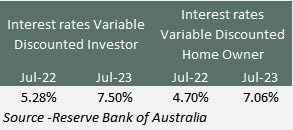
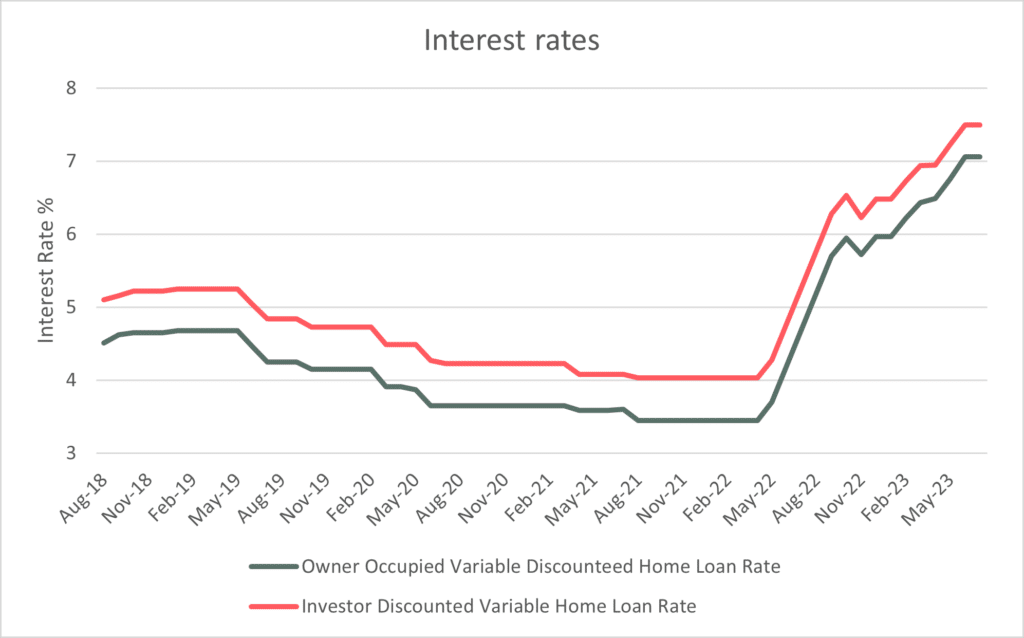
Source – Reserve Bank of Australia
Market Rates
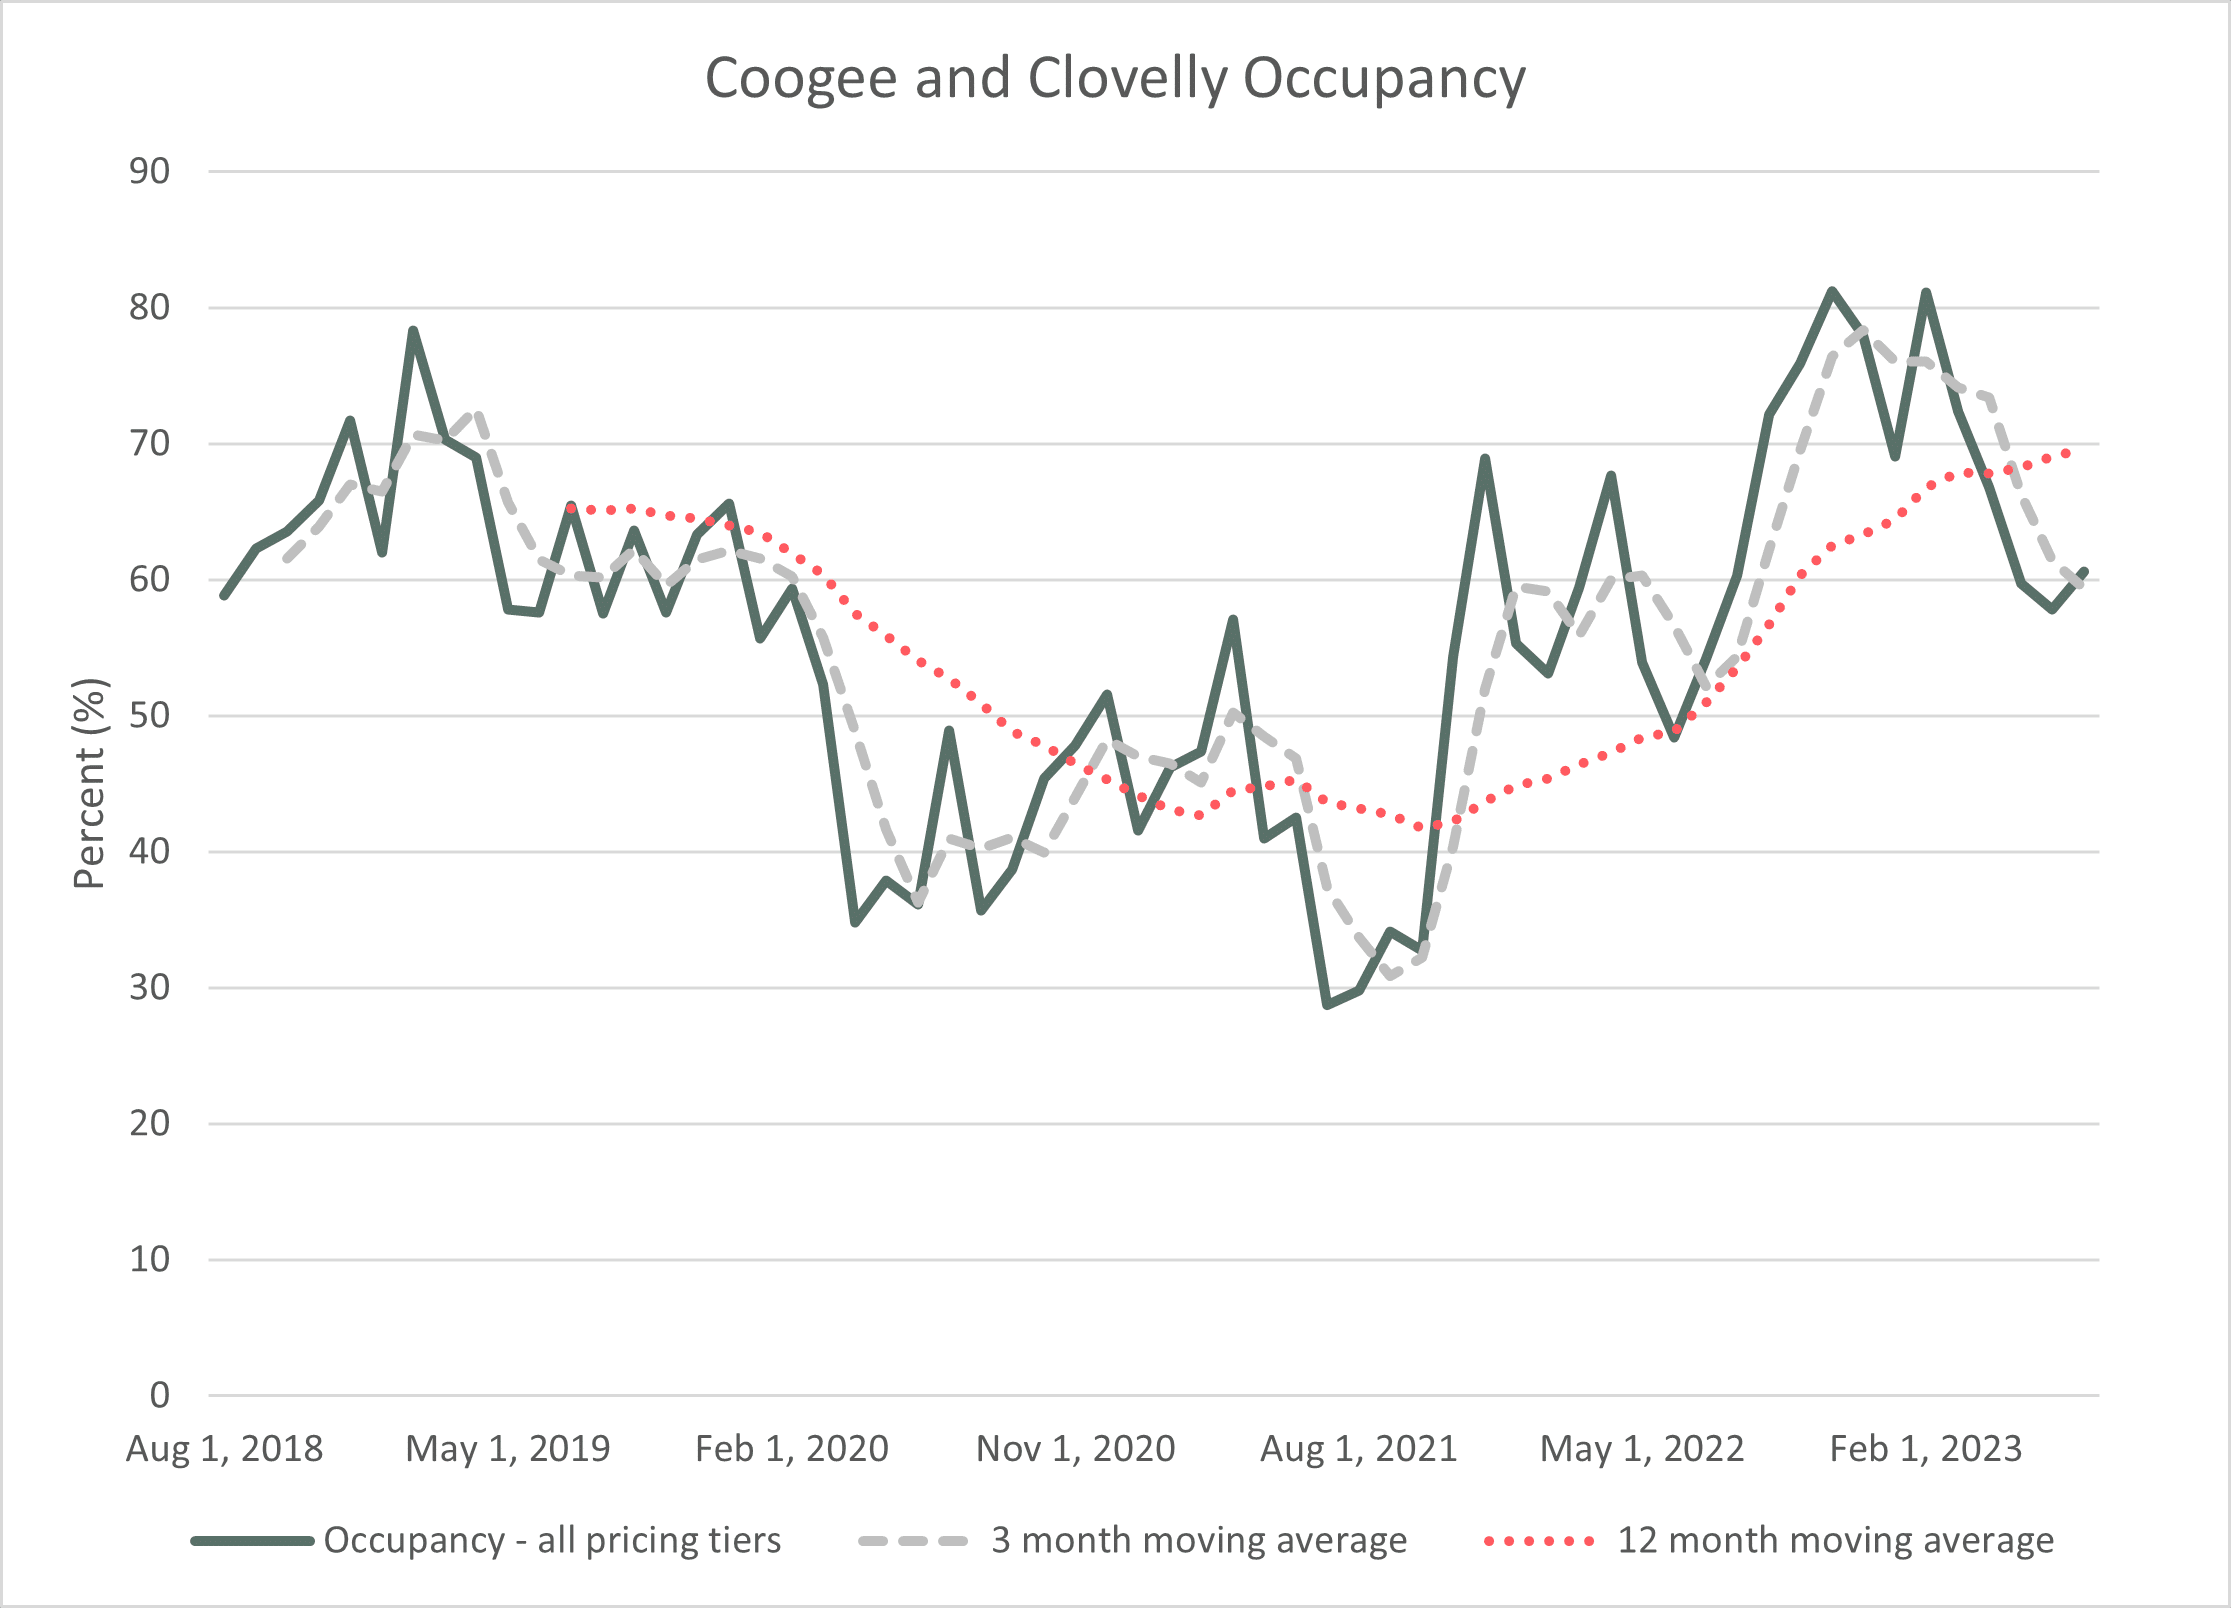
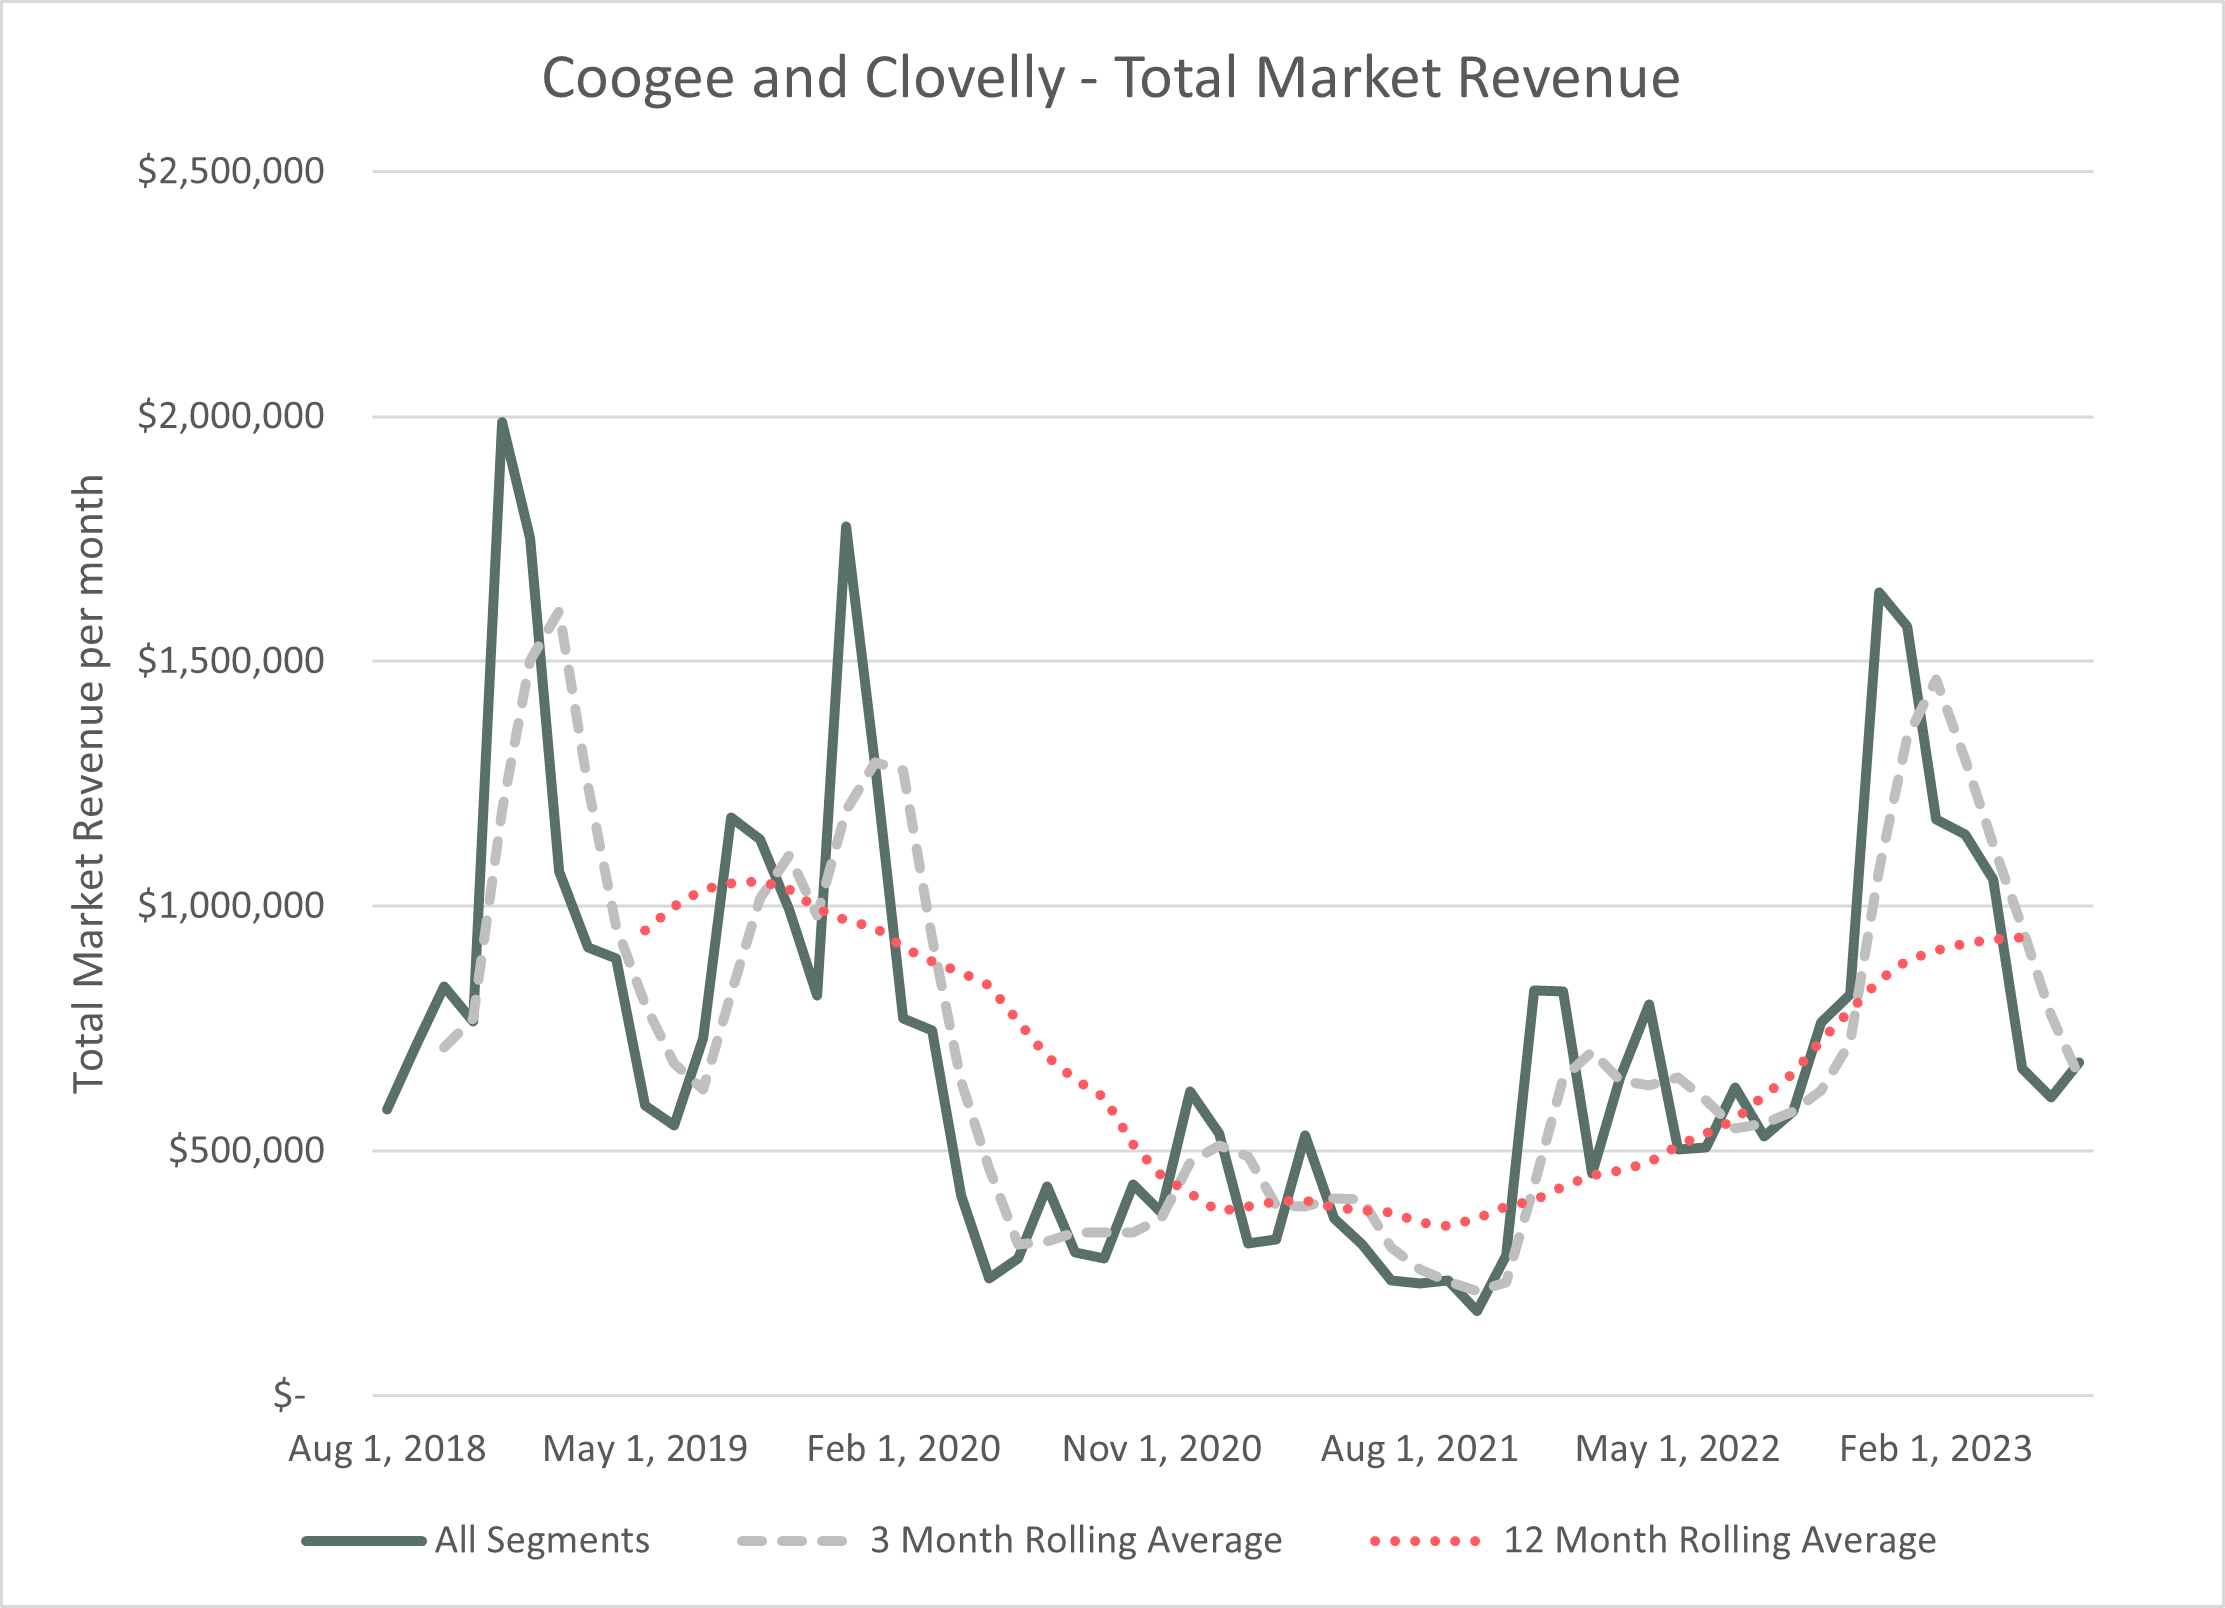
Market revenue outside of the seasonal peaks and troughs has shown little activity. Single-digit growth has mainly been driven by improved occupancy from just 54% to 58% over the last 12 months. Growth will be slow until short-term visitors are back at levels we saw prior to COVID.
Source: AirDNA
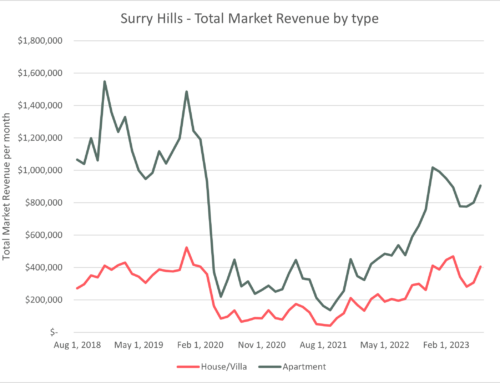
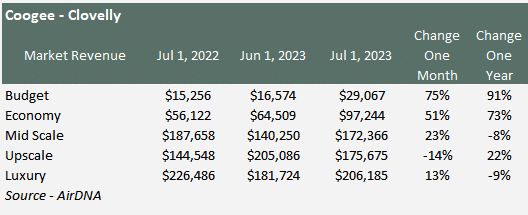
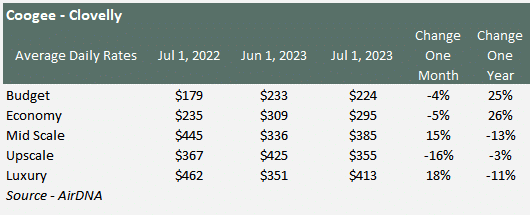
The market is categorised into five quintiles: Budget, Economy, Mid-Scale, Upscale, and Luxury. In the last 12 months, there has been high double-digit growth in the budget and economy segments, but these segments come from a very low base and represent just 19% of the total market. Upscale properties along with mid-scale represent 25% each and Luxury 30%. Mid-scale and Luxury saw a decline in revenue over the last 12 months, picked up in part by Mid-scale, which saw an increase of 22%.
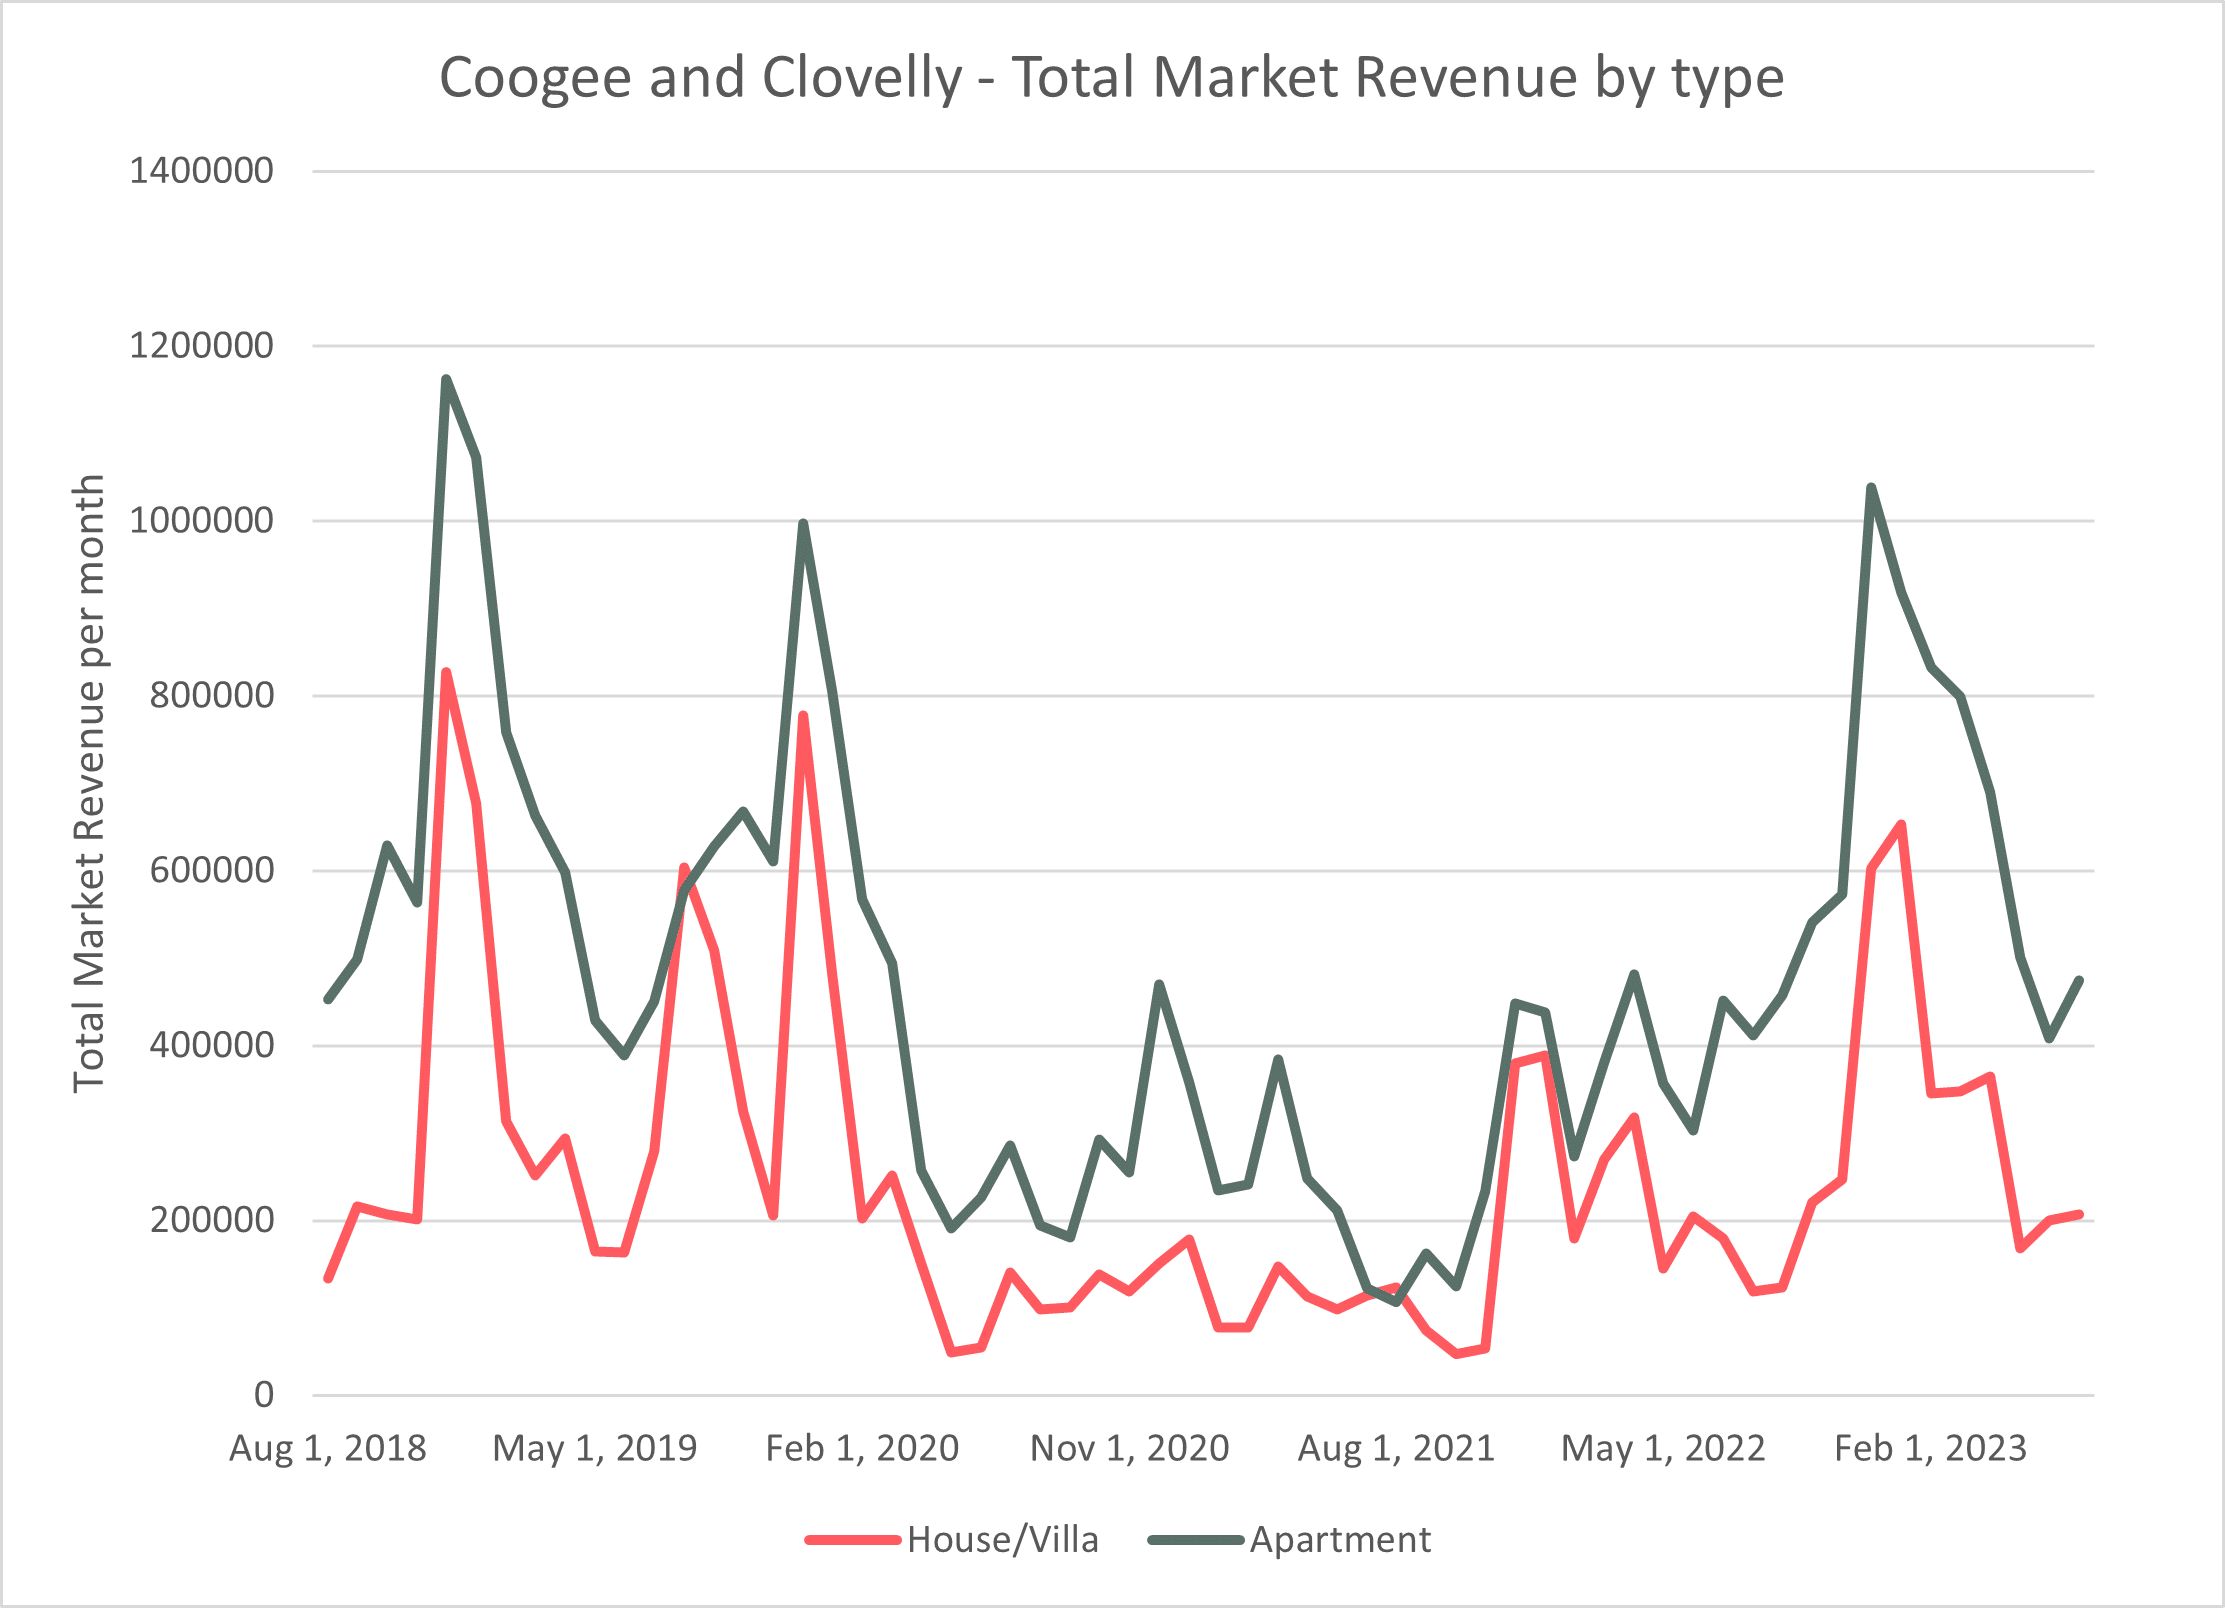
Apartments represent 69% of market revenue earned in Coogee and Clovelly. Apartment growth has been 5% over the last 12 months, and Houses 15%. However, in the period June to July, Apartments showed a growth of 16% in market revenue.
Source: AirDNA
Average Daily Rates
Source: AirDNA
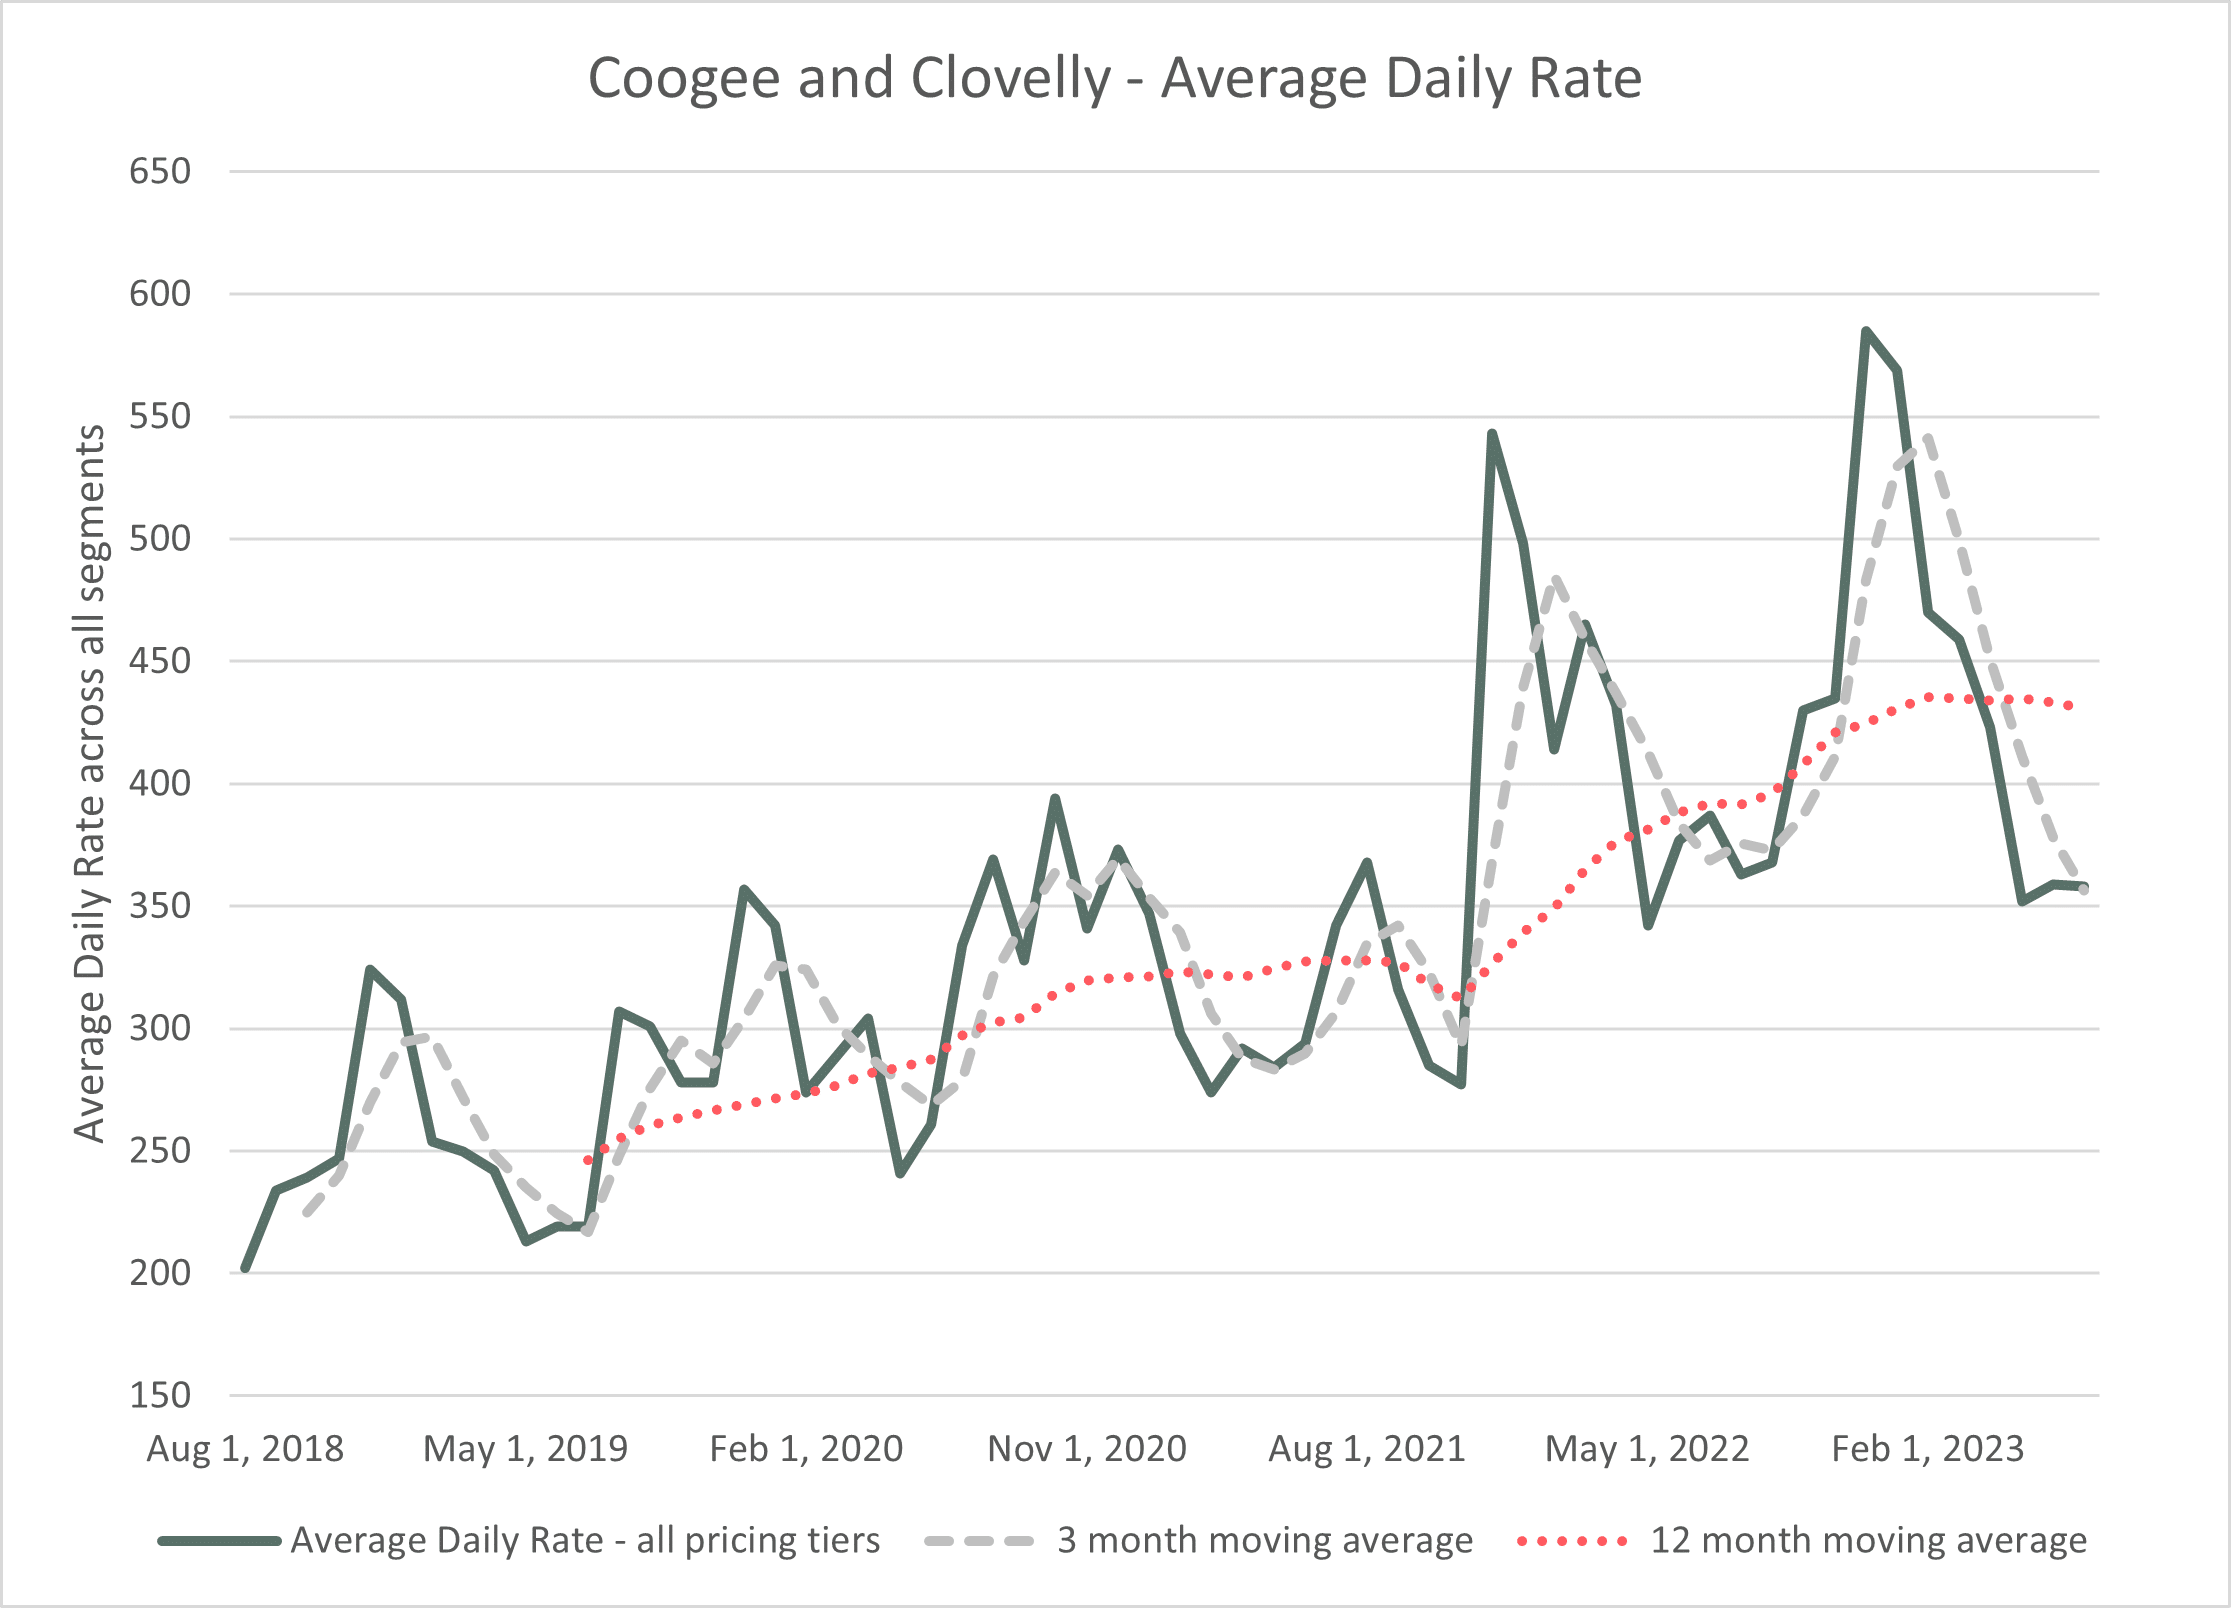
The total growth rate in daily rates has been negative 7% over the last 12 months. We have seen double-digit growth in the Budget and Economy segments of 25% and 26%, but these segments come from low bases. In the meatier end of Mid-scale, upscale, and Luxury, rates have declined over the last 12 months. However, overall, the trend remains upward on a 12-month cycle.
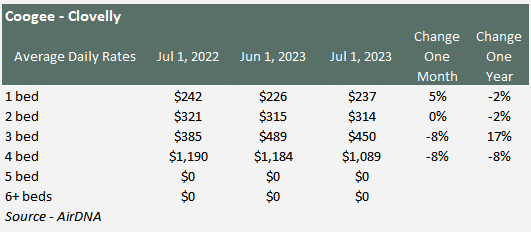
The last 12 months have not been very positive in the Coogee and Clovelly market. The one small glimmer of positive news was the 17% rise in Average daily rates for 3-bed houses, which represent 25% of active listings. The other segments have all seen negative growth in Average daily rates over the last 12 months.
Occupancy
The one bright point in the Coogere and Clovelly market that we highlighted at the beginning was the improvement in the occupancy rate. The occupancy did drop to a low in July 2021 of 28.7%.
Source: AirDNA
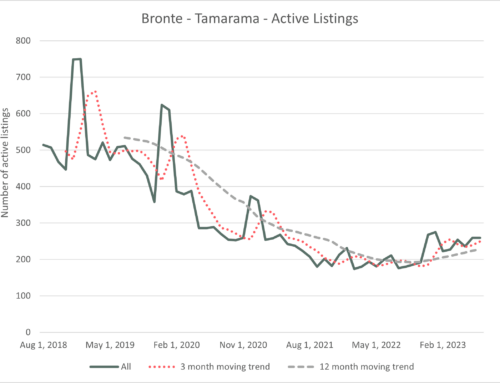
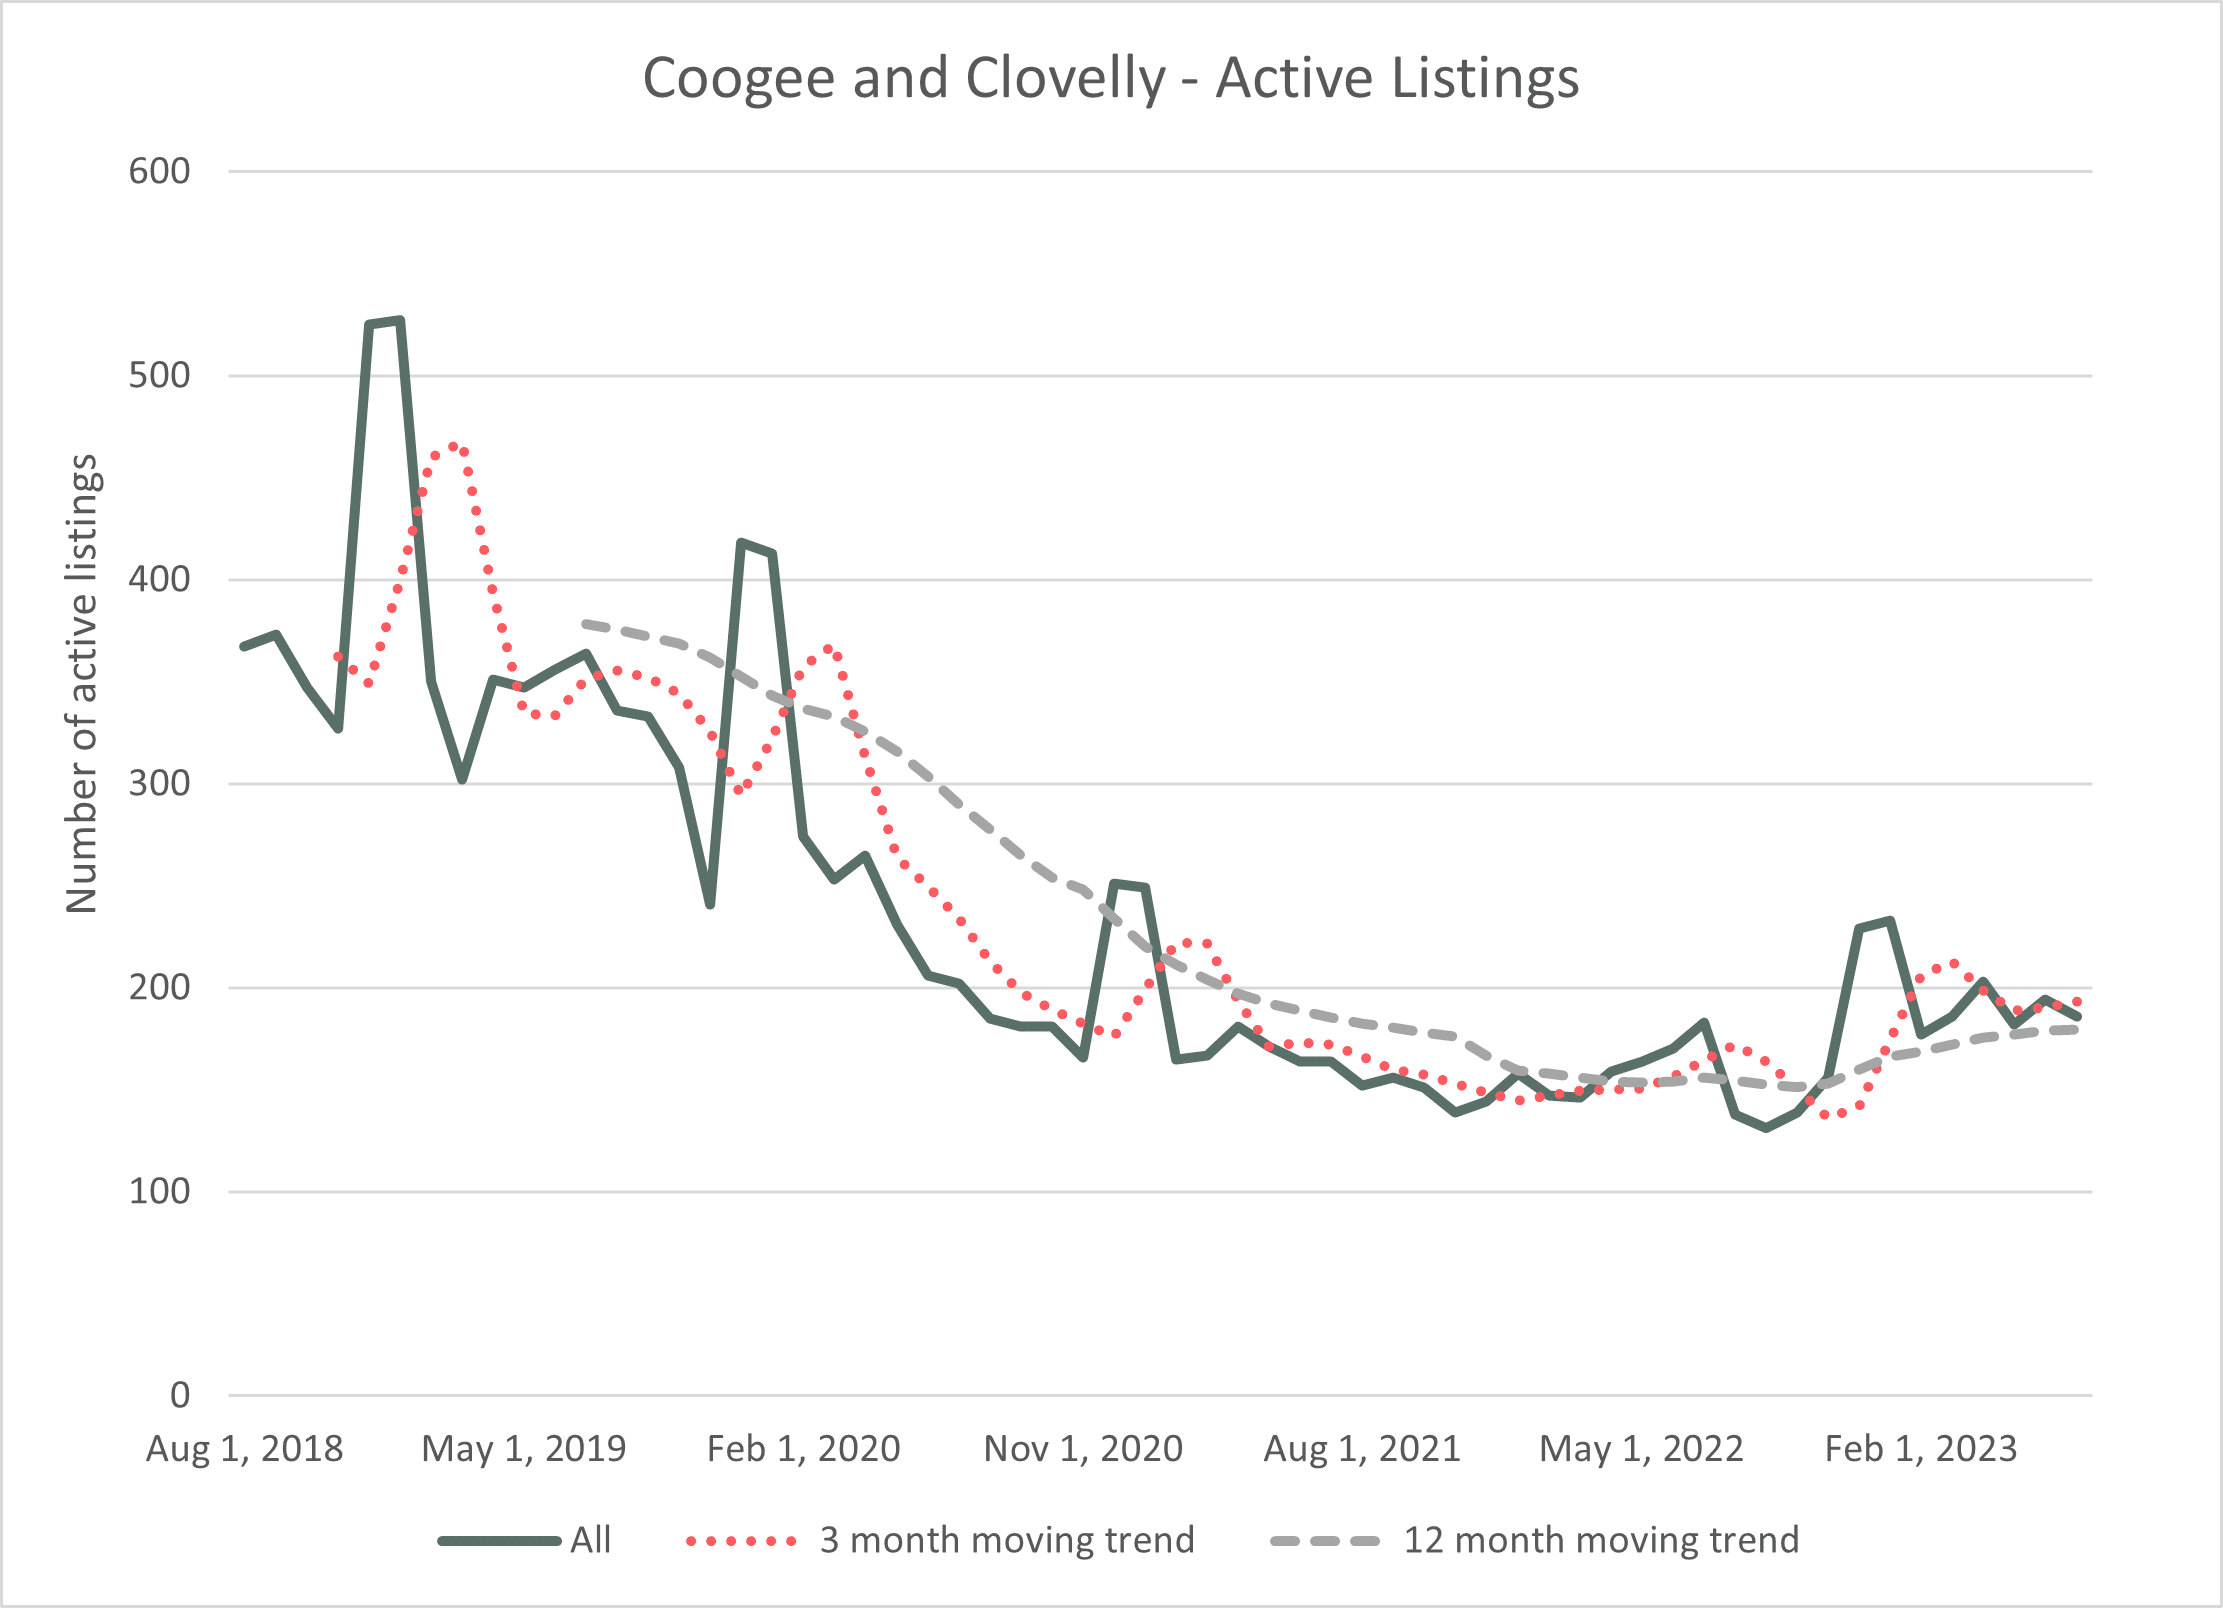
Active Listings
Like most regions, Coogee and Clovelly are no different, and active listings are still well below the levels before COVID. Active listings for July 2023 were 186, down from the high in January 2019 of 527.
Source: AirDNA
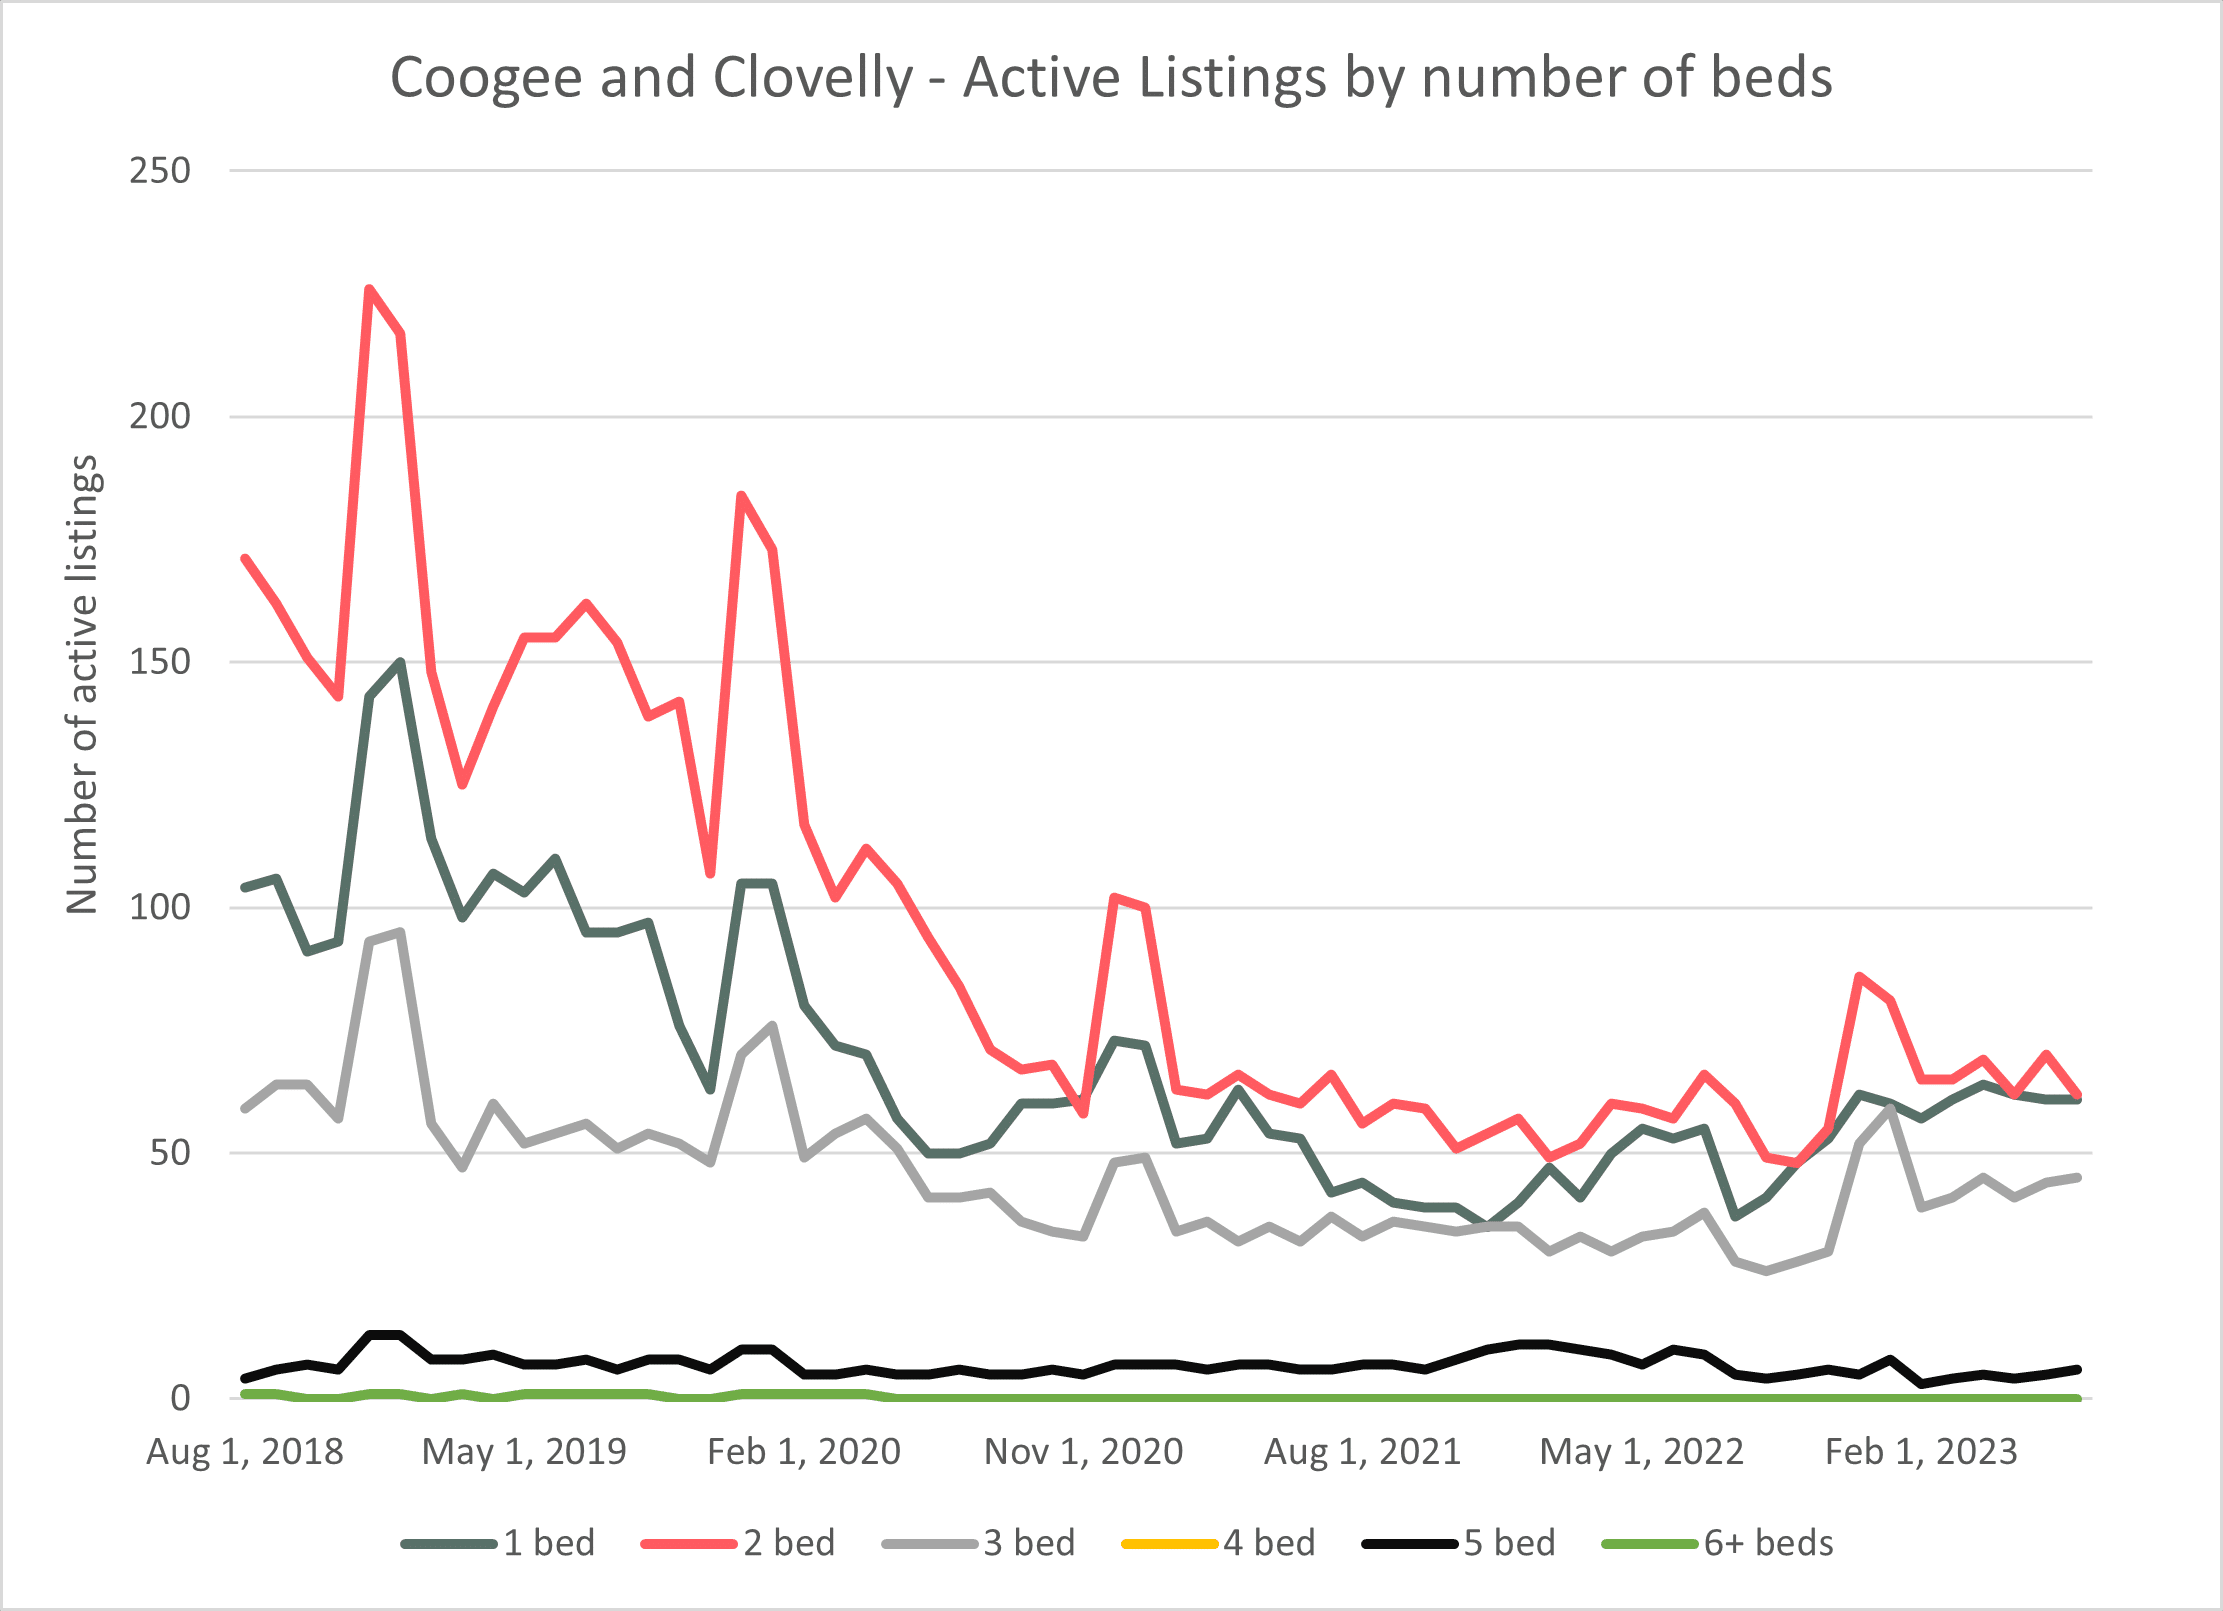
Overall growth in active listings was just 2% over the last 12 months. Two segments, 1-bed and 3-bed, showed positive growth of 11% and 18% while 4-bed and 5-bed showed negative growth in active listings. 2 Bed, the largest sector, had a 6% decline in listings over the last 12 months.
Source: AirDNA
Talk to HomeHost about managing your property in Surry Hills. Call today on 1300 171 718.
AIRDNA Terms
Active Listing Nights – Count of nights within a given period that are not blocked and are either reserved or available as long as there has been a reservation within the last 28 days.
Active – Active vacation rentals are those that had at least one calendar day classified as reserved or available during the reporting period.
Available Listings – Total number of listings whose calendars had at least one day classified as available or reserved during the reporting period.
Average Daily Rate (Native) – Average daily rate (ADR) of booked nights in USD. ADR = Total Revenue / Booked Nights. Includes cleaning fees.
Market Revenue – Total revenue generated in a segment for that period.
Occupancy Rate – Occupancy Rate = Total Booked Days / Active Listing Nights
See the full list of definitions here.
Need expert Airbnb Management?
Talk to Home Host – call 1300 171 718.